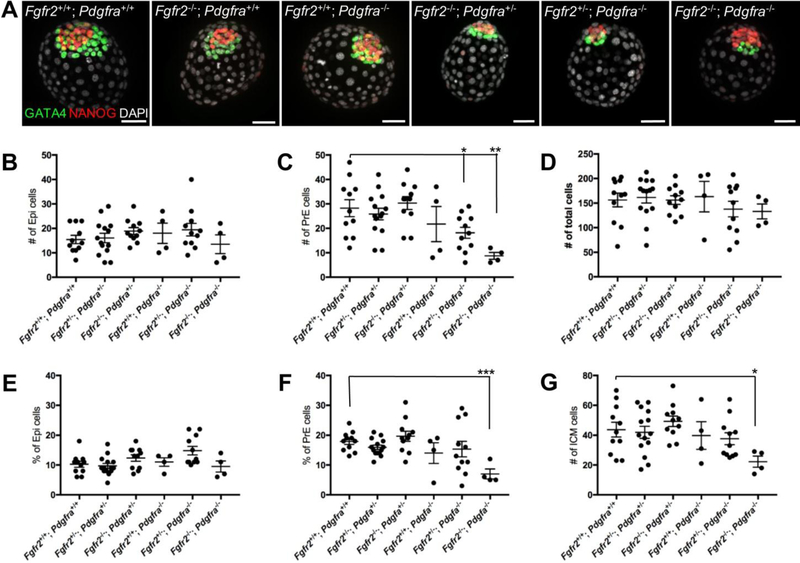
Figure 2.
PrE development is deficient in Fgfr2−/−; Pdgfra−/− embryos. (A) E3.5 embryos were cultured for 48h in DMEM and stained with antibodies to NANOG (red) and GATA4 (green). DAPI (white) was used to counter-stain nuclei. Number of Epi (B), PrE (C) and total cells (D) were counted in E3.5 embryos cultured for 48h in DMEM. Percentages of Epi (E) and PrE (F) cells relative to the total number of cells are shown. (G) Number of ICM cells is shown. Data represented as mean + SEM. *, p=0.02; **, p=0.006. Scale bars, 50 μm.

