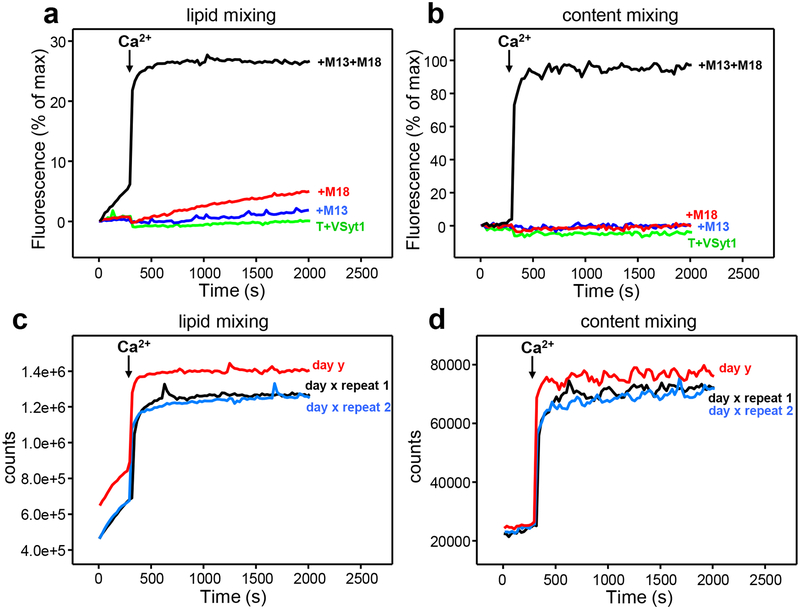
Figure 3.
Typical results obtained in our reconstitution experiments. Lipid mixing (a) between VSyt1- and T-liposomes is monitored from the fluorescence de-quenching of Marina Blue-labeled lipids and content mixing (b) is monitored from the development of FRET between PhycoE-Biotin trapped in the T-liposomes and Cy5-Streptavidin trapped in the VSyt1-liposomes. The assays were performed in the presence of NSF-αSNAP without other additional proteins (T+VSyt1) or in the presence of Munc18–1 (M18) and/or Munc13–1 C1C2BMUNC2C (M13) as indicated. Experiments were started in the presence of 100 μM EGTA and 5 μM streptavidin, and Ca2+ (600 μM) was added after 300 s. The data were normalized as described in step 25. (c,d) Raw data (i.e. without normalization) obtained in analogous experiments performed with T- and VSyt1-liposomes in the presence of NSF-αSNAP, Munc18–1 and Munc13–1 C1C2BMUNC2C under the same conditions as those used in (a,b) to illustrate the typical variability observed in analogous experiments performed with the same liposome preparations in the same day (day × repeats 1 and 2) or in different days (compare data from day y with data from day x).

