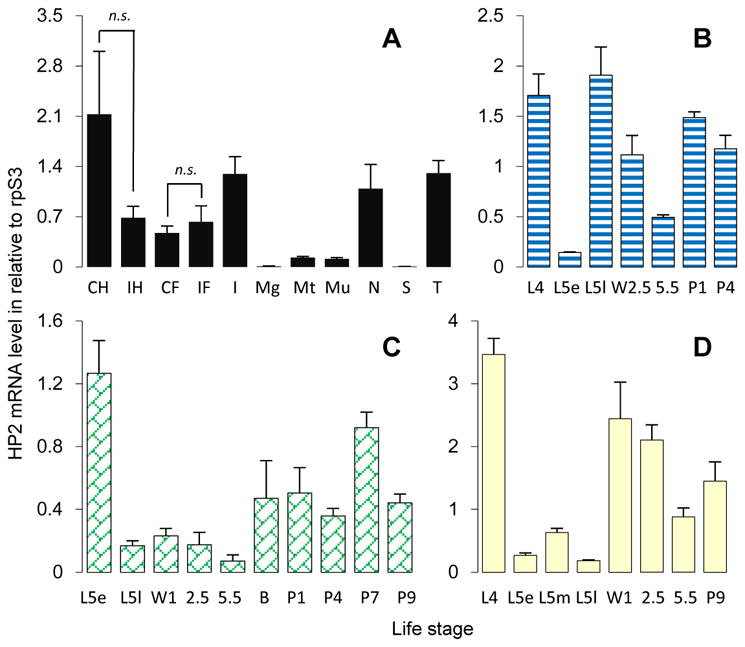
Fig. 1.

M. sexta HP2 mRNA immune inducibility and expression profiles in various tissues at different life stages. (A) Immune inducibility and tissue distribution. Relative mRNA levels of control (C) and induced (I) hemocytes (H) and fat body (F) were calculated based on Ct values from three biological replicates (3 larvae per sample) and plotted as a bar graph (mean ± SD, n = 3). Pairwise comparisons were performed between C and I using Students’ t-test (*, p < 0.05; n.s. or not significant, p > 0.05). RNA samples of other tissues (I, integument; Mg, midgut; Mt, Malpighian tubules; Mu, muscle; N, nerve tissue; S, salivary gland; T, trachea) from day 3, 5th instar naïve larvae were prepared and analyzed by qPCR under the same conditions. (B–D) Developmental profiles of HP2 transcripts in hemocytes (B), integument (C), and fat body (D). The mRNA levels in these three tissues from larvae and pupae at different stages were determined by the same method. “L4”, 4th instar larvae, day 2; “L5”, 5th instar (“e” for early or day 1; “m” for middle or day 2; “l” for late or day 3–4); “W”, wandering (day 1, 2.5 or 5.5); “B”, bar stage; “P”, pupal (day 1, 4, 7 or 9).
