
Fig. 3.
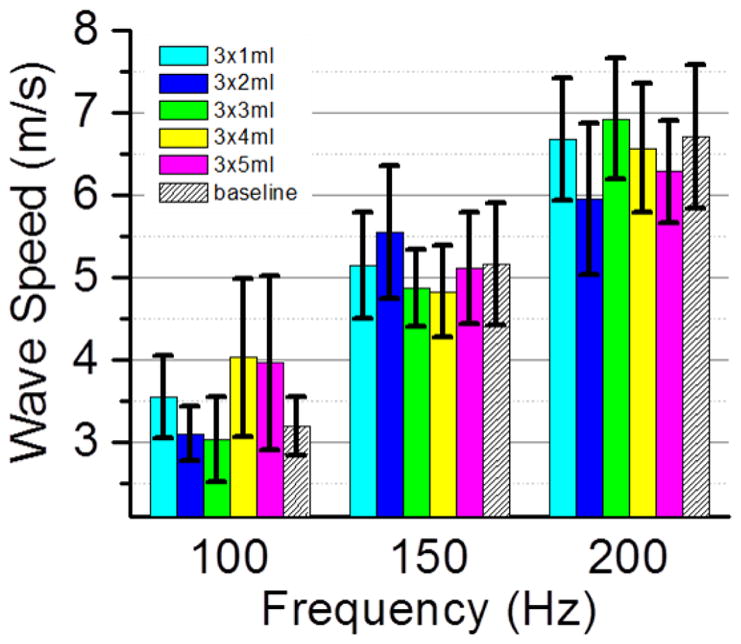
Sponge surface wave speeds obtained for six sponge conditions at three shaker frequencies 100, 150 and 200 Hz. The baseline was measured when the sponge was dry and is shown with slanted lines in the graph. Water was added in an increment of 1 ml at three locations in the middle of the purple sponge surface. The total amount of the added water was listed in the figure legend after each color code. The uncertainties are represented by black vertical bars. While surface wave speed increased with shaker frequency, the data among different sponge conditions were similar at each shaker frequency.