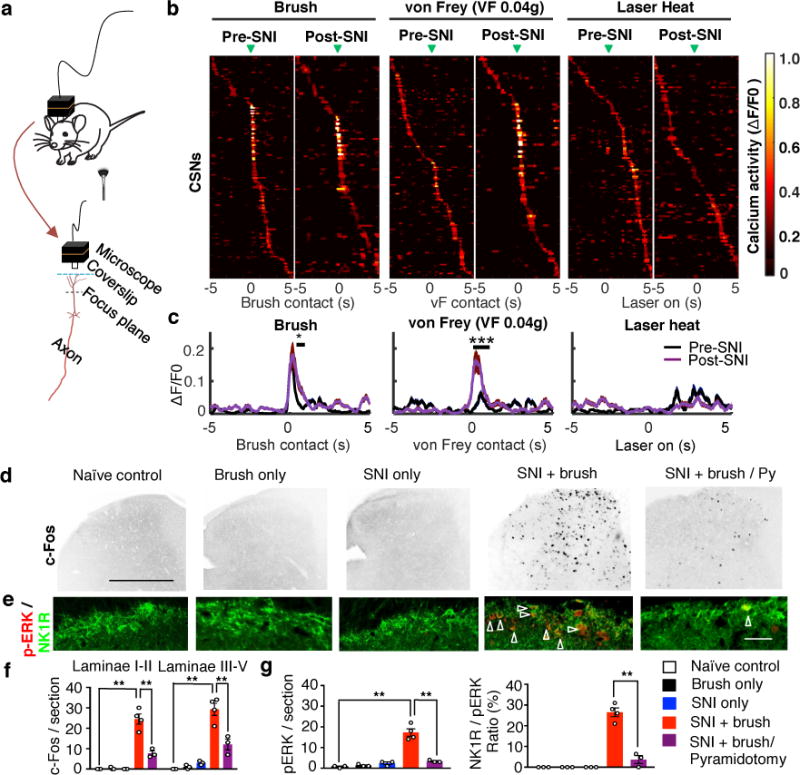
Fig. 3. Light touch elicited activation of somatosensory CSNs and spinal dorsal horn neurons.

a, Diagrams showing calcium activity imaging in S1 CSNs by a head-mounted miniaturized microscope. b, Trial-average activity of CSNs in response to indicated sensory stimuli before and after SNI. Active calcium event traces were aligned to the time when the brush (Pre-SNI: n=156 neurons from 4 mice, Post-SNI: n=103 neurons from 4 mice), von Frey (Pre-SNI: n=151 neurons from 4 mice, Post-SNI: n= 94 neurons from 4 mice), or laser (Pre- SNI: n=156 neurons from 4 mice, Post-SNI: n= 116 neurons from 4 mice) affected the hindpaw (green arrowheads). Trial averages (13-17 trials/mouse) were sorted based on peak activity time. Arrowheads indicate onset of stimulation. c, Average response to brush, von Frey (0.04g) and laser heat stimuli pre- and post-SNI. Number of neurons is the same as listed in b. *and ***, P=0.03 and 0.0002 for brush and von Frey, respectively, ranksum test. d-g Representative images (d,e) and quantification (f,g) of c-Fos and pERK (red)/NK1R (green) immunoreactivity in the dorsal horn of the spinal cord (L3-L4) in naïve control (n=3), brush only (n=3), SNI only (n=3), SNI and brush (n=4), SNI and brush with pyramidotomy (n=3) animals. Scale bar: 500 and 100 μm in d, e, respectively. Arrowheads indicate the co-localization of pERK and NK1R immunostaining. For f and g, one-way ANOVA followed by Bonferroni correction. P=0.0008 for SNI+brush with/without Py in f, P<0.0001 for all others with **. Data are presented as mean±SEM.
