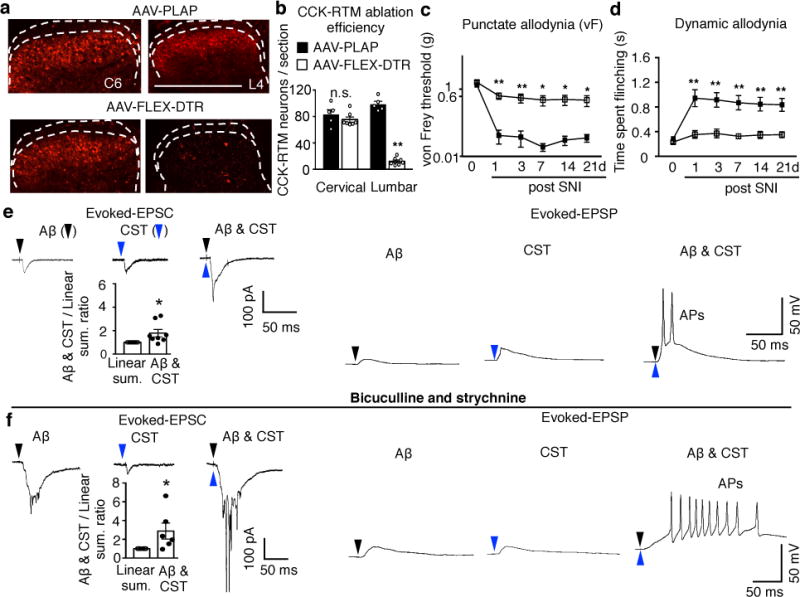
Fig. 4. Lumbar CCK+ neurons receive convergent Aβ and CST inputs and are required for mechanical allodynia.

a-b, Representative images (a) of cervical and lumbar spinal cord dorsal horn in control (AAV-PLAP, n=5) or CCK-RTM neuron ablated (AAV-FLEX-DTR, n=7) mice with quantification (b). P =0.35 and < 0.0001 for cervical and lumbar, respectively, two-sided t test. c-d, Measurement of punctate and dynamic mechanical allodynia after SNI in control (n=8) or CCK-RTM interneuron ablated (n=7) mice. Two-way repeated measures ANOVA followed by Bonferroni correction. P=0.002,0.01,0.03,0.03,0.04 and P<0.0001, =0.0003,0.0003,0.0009,0,0014 for 1,3,7,14, and 21d, respectively. e-f, Averaged traces of EPSCs evoked by Aβ, CST, and co-stimulation (−70mV, voltage clamp, left) or representative trace of EPSP/AP (current clamp, right) in CCK-RTM neurons without (e) or with bicuculline/strychnine treatment (f). Bar graphs under EPSC curves: Relative change of eEPSC amplitude evoked by Aβ/CST co-stimulation compared to the sum of amplitudes evoked by individual stimulation (n=8, in e, P=0.02; n=6, in f, P=0.04), one-sided paired t-test. Data are presented as mean±SEM.
