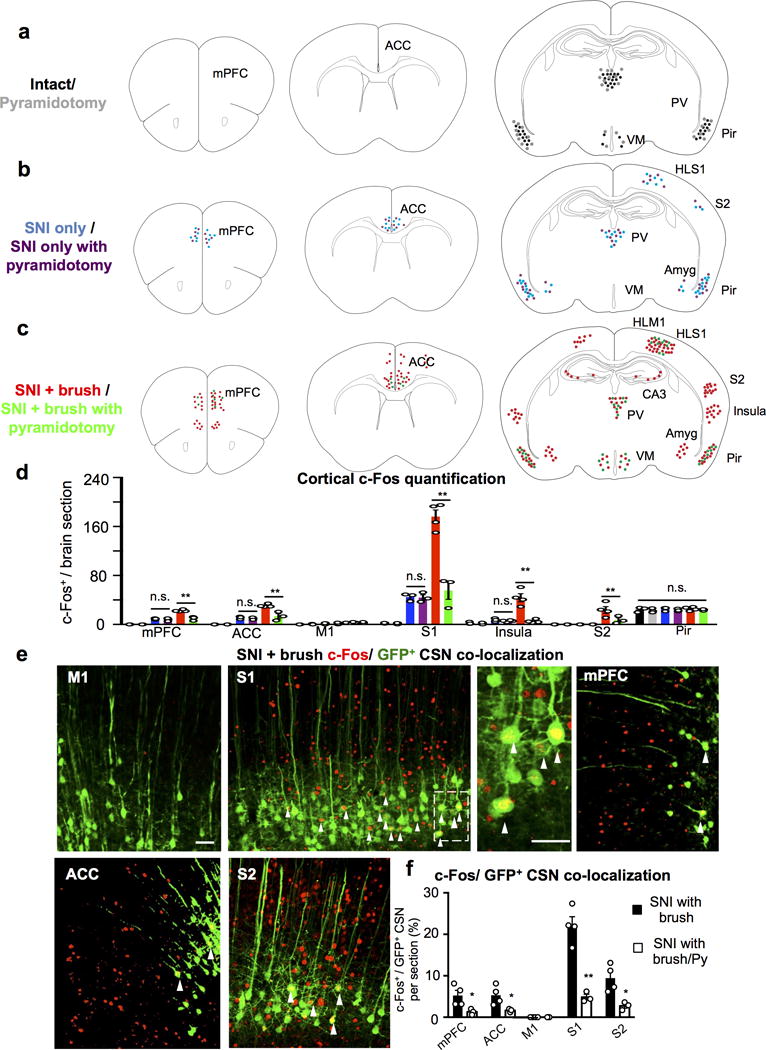
Extended Data Figure 7. Neuronal activity in cortical and subcortical areas upon light touch after SNI.

a-c, Cartoon drawing of c-Fos immunostaining in intact (a), SNI only (b) and SNI with light brush (c) conditions from control and mice with pyramidotomy. mPFC: medial prefrontal cortex, ACC: anterior cingulate cortex, S1HL: hindlimb primary somatosensory cortex, S2: secondary somatosensory cortex, Pir: piriform cortex, PV: periventricular nucleus of the thalamus, VM: ventromedial nucleus of the hypothalamus, and Amyg: amygdala. d, Quantification of c-Fos+ cells in multiple cortical areas in intact (with CSN: n=3, with pyramidotomy: n=3), SNI only (with CSN: n=3, with pyramidotomy: n=3), SNI with light brush (with CSN: n=4, with pyramidotomy, n=3) mice. **, P < 0.01, n.s., no statistical significance. PFC SNI only with or without Py: P>0.99; PFC SNI+ brush with or without Py: P<0.0001; ACC SNI only with or without Py: P>0.99; ACC SNI+ brush with or without Py: P=0.0002; M1 SNI only with or without Py: P>0.99; M1 SNI+ brush with or without Py: P>0.99; S1 SNI only with or without Py: P>0.99; S1 SNI+ brush with or without Py: P<0.0001; Insula SNI only with or without Py: P>0.99; Insula SNI+ brush with or without Py: P<0.0001; S2 SNI+ brush with or without Py: P=0.0075; Pir all conditions (ANOVA): P=0.82. One Way ANOVA followed by Bonferroni correction. e, Representative images of multiple cortical areas stained with c-Fos (red) and GFP (green, HiRet-GFP injection) in SNI mice with light brush. Arrowheads mark the co-localization of c-fos and GFP+ CSNs. Scale bar: 20 μm. f, Quantification of c-Fos+/GFP+ CSN co-localization in multiple cortical areas in animals with SNI following light brush without (n=4) or with pyramidotomy (Py, n=3). * or **, P < 0.05 or P < 0.01, P=0.03, 0.04, 0.0009, 0.02 for mPFC, ACC, S1, and S2, respectively. two-sided student’s t test. Data are presented as mean ± SEM.
