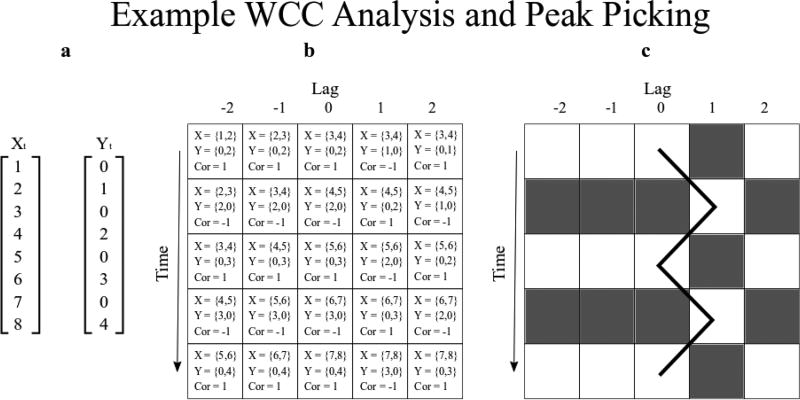
Figure 1.
Sub-figures are (a) two time series to be window cross-correlated, (b) sections of (a) used to make each cell of the WCC matrix with window size = 2, window increment = 1, max lag = 2, and lag increment = 1, (c) shaded version of (b) with example peak picking algorithm following the peak positive correlation from lag 0. Notice how the black line follows the peak positive correlation value over time. By recording the correlation values of the elements of this matrix traced by this line, and the lag associated with each peak correlation value, one can determine 4 synchrony measures: mean peak correlation, sd peak correlation, mean lag, and sd lag.

