
Figure 3.
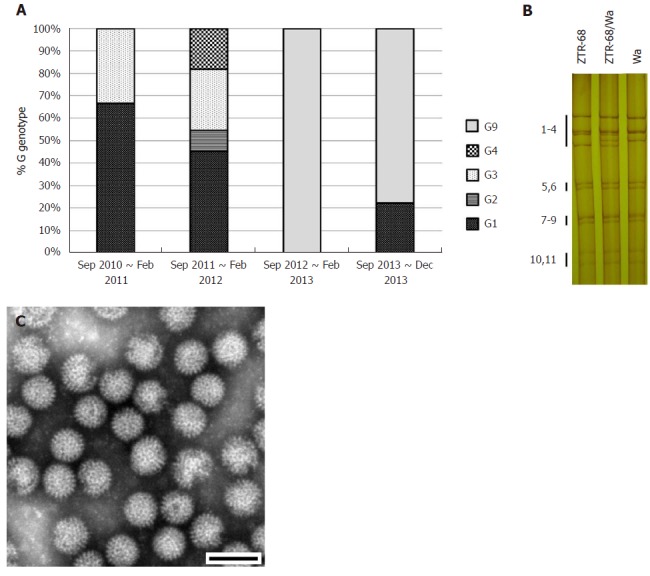
Rotavirus G genotype distribution and characterization of strain ZTR-68. A: Rotavirus G genotype distribution during rotavirus peak season (September to February) from 2010 to 2013, on the basis of rotavirus VP7 genes sequences analysis; B: Electrophoretic pattern of ZTR-68/Wa. Electrophoretic migration pattern of RNA from rotavirus. Viral genomic dsRNAs extracted were separated in 10% polyacrylamide gels and visualized by silver staining. Numbers indicate the order of the ZTR-68 and Wa gene segments; C: Rotavirus strain ZTR-68, Bar = 100 nm.