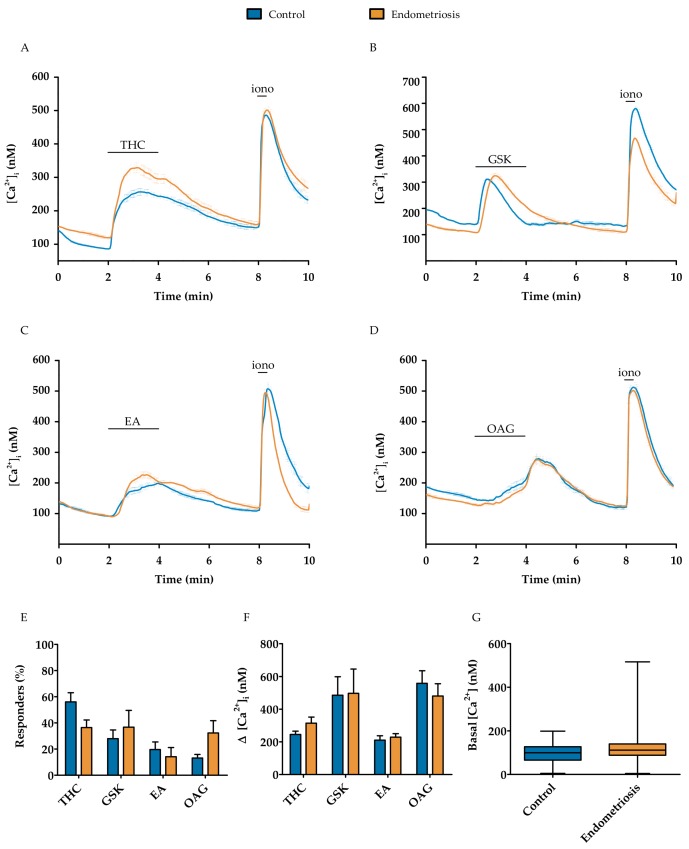
Figure 3.
The functional expression of TRPV2, TRPV4, TRPC1/4, and TRPC6 using Ca2+ microfluorimetry in hESC of endometriosis patients compared to the controls. (A–D) Average ± SEM traces of 50 µM THC-, 10 nM GSK-, 250 nM EA-, and 100 µM OAG-induced Ca2+ changes ([Ca2+]i), respectively, in control and endometriosis hESC; (E) Number of responders in which an increase of at least 100 nM of the intracellular calcium concentration was observed upon application of the agonist; (F) Increase in intracellular calcium upon application of TRP agonists; (G) Basal intracellular calcium concentration of responders. Data are presented as mean + SEM. Statistically significant changes in responders and calcium influx were assessed using the Two-way ANOVA statistical test with Bonferroni correction, basal calcium levels using a t-test.

