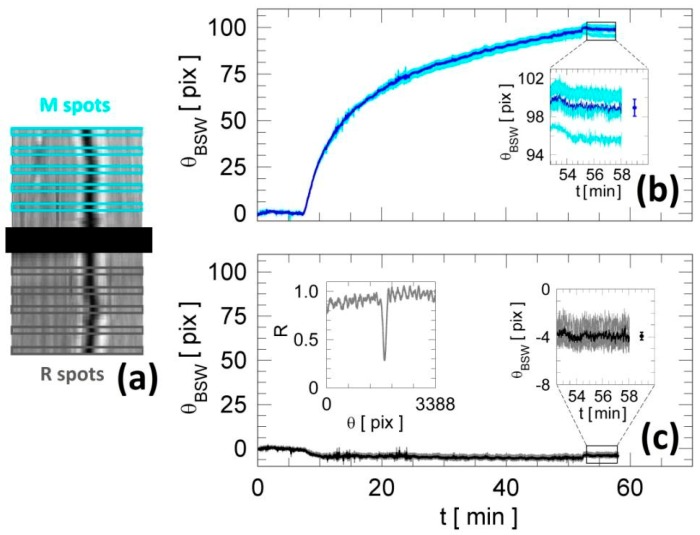
Figure 3.
(a) 2D reflectance map through the CCD camera and definition of the five sensitive spots for both M and R regions. (b) Label-free angular spread on five adjacent spots in the measurements (IgG) and (c) reference regions (Anti-Ova) after analyte (Anti-IgG) interaction. The blue and black lines correspond to averaged curves from measurement and reference regions, respectively. In the zoomed areas, the points are the mean values with standard deviation for the five label-free residual angular shifts. In the inset of (c), an experimental reflectance is shown for one of the reference spots.

