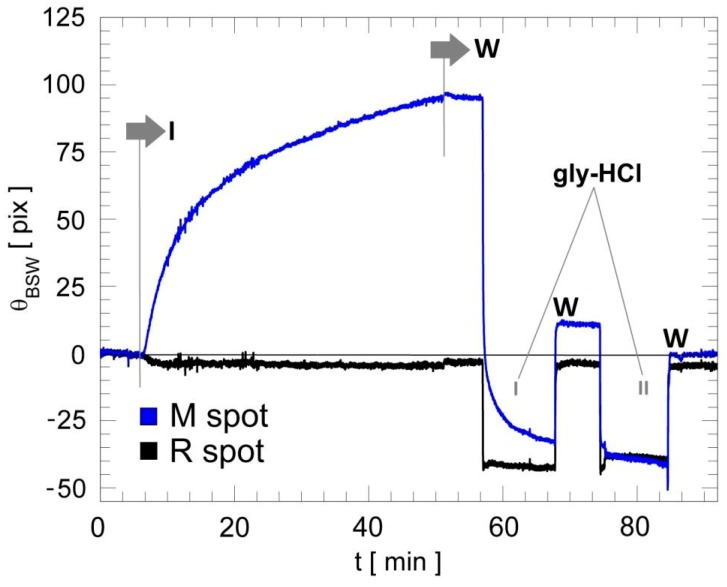
Figure 4.
Sensograms of two spots in response to an Anti-IgG injection and two regeneration steps in sequence. The two sensograms correspond to the reference spot with anti-ovalbumin antibody (R, black curve) and the signal spot with human IgG antibody (M, blue curve). Then 10 min regeneration steps are performed to recover the starting conditions (before Anti-IgG injection, I marker). W indicates the washing steps.

