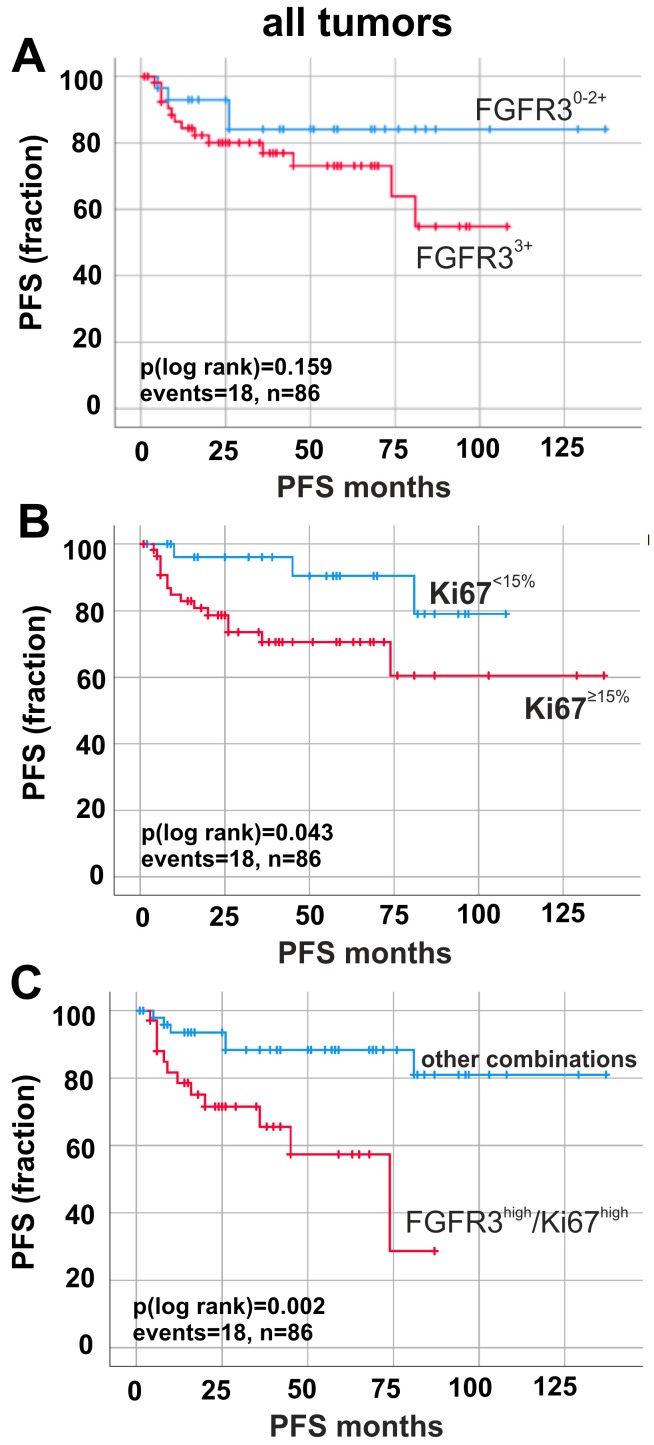
Figure 2.
Prognostic impact of FGFR3 and Ki67 protein expression in all tumors (pTa, pT1 and pT2–4). Kaplan–Meier survival curves display progression-free survival (PFS). (A) Survival curves of patients with high FGFR3 expression (red curve, n = 56) compared to low FGFR3 expression (blue curve, n = 30). (B) Kaplan–Meier analysis of patients with high Ki67 expression (red curve, n = 56) compared to low Ki67 expression (blue curve, n = 30). (C) Survival curve analysis of FGFR3high/Ki67high expression (red curve, n = 34) compared to all other combinations of FGFR3 and Ki67 expression (blue curve, n = 32). n: overall number of cases; events: overall events of tumor progression.

