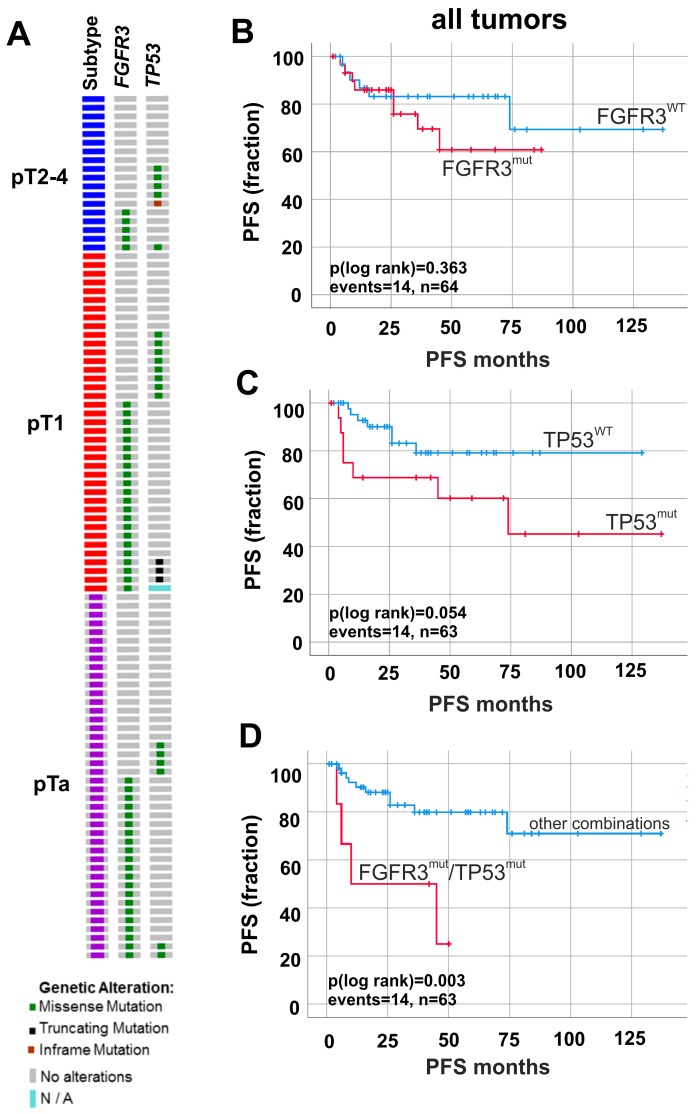
Figure 4.
FGFR3 and TP53 mutation frequency and prognostic impact on tumor progression. (A) Oncoprint graph for FGFR3 and TP53 mutation analysis. (B–D) Kaplan–Meier survival curves display progression-free survival (PFS). (B) Survival curves of tumors with detected FGFR3 mutations (red curve, n = 30) compared to non-mutated FGFR3 gene status (blue curve, n = 34). (C) Kaplan–Meier analysis of tumors with mutated TP53 (red curve, n = 17) compared to wildtype TP53 (blue curve, n = 46). (D) Impact of double mutations on risk stratification of tumor progression is demonstrated. Univariate analysis of double mutations (red curve, n = 6) compared to all other combinations of mutated and non-mutated FGFR3 and TP53 genes (blue curve, n = 57). n, overall number of cases; events, overall events of tumor progression.

