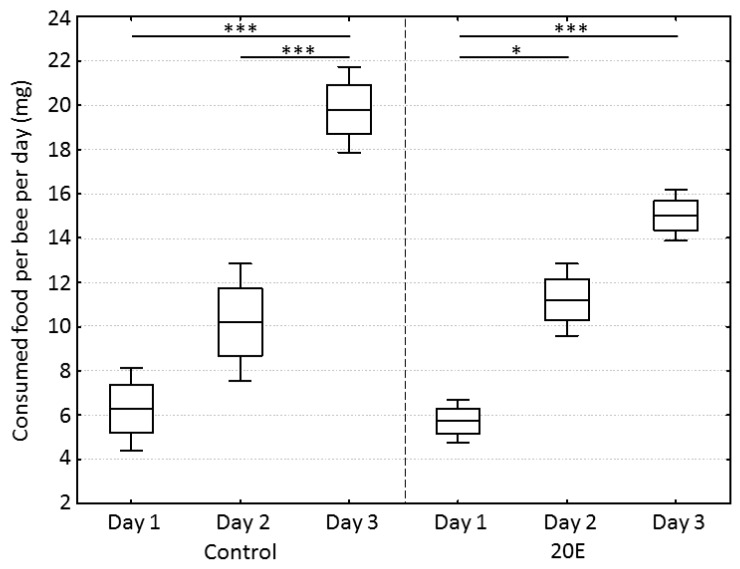
Figure 1.
Food consumption per bee per day in mg between control and 20-hydroxyecdysone (20E) group. Boxes show means ± standard errors (SEs) and whiskers show standard deviations (SDs). Statistics were performed using a one-way ANOVA with post-hoc Bonferroni test. Significant differences are indicated by asterisks (*** p < 0.001, * p < 0.05).

