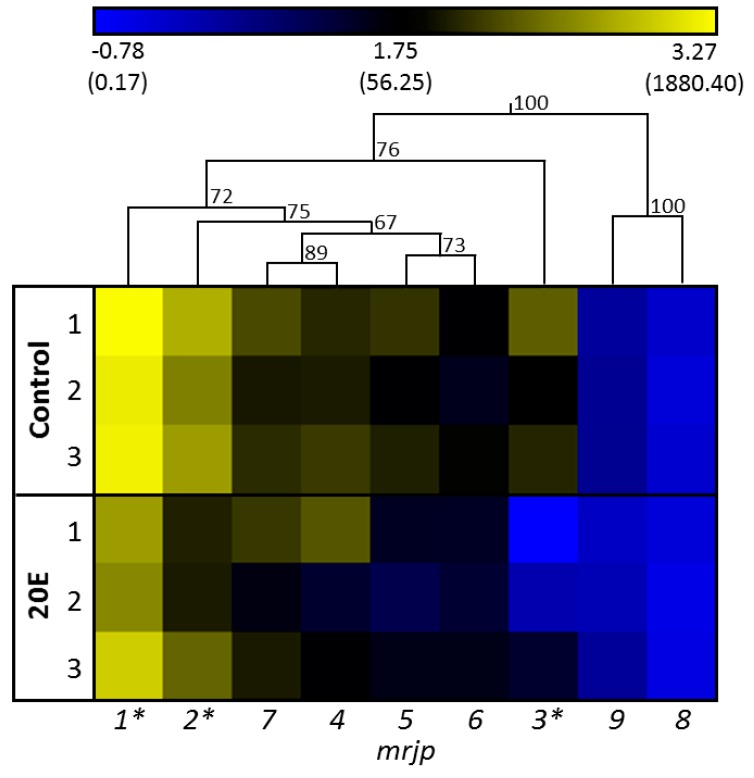
Figure 2.
One-way hierarchical clustering analysis heat map and dendrogram of mrjp gene expression in the control group compared to the 20E group. Each group comprised three cage replicates, with nine analyzed honey bees per replicate. Gene expression is presented as a color gradient across all samples, from deep blue (lowest) to light yellow (highest). Asterisks indicate significant differences (p < 0.05) between control group and 20E group (general linear model (GLM), post-hoc Bonferroni test). Expression values were log transformed for the clustering. Relative gene expression values are shown in brackets.

