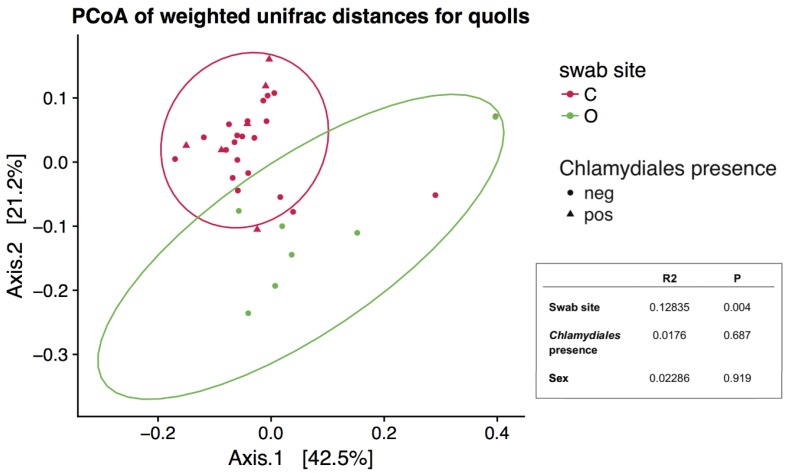
Figure 5.
Principal Coordinates Analysis plot based on ordination of weighted Unifrac distances. Only northern quoll samples were included, ellipses represent 95% confidence intervals. Inset is the results from a PERMANOVA analysis, where R2 represents the effect size (from 0–1) and P is the p value.

