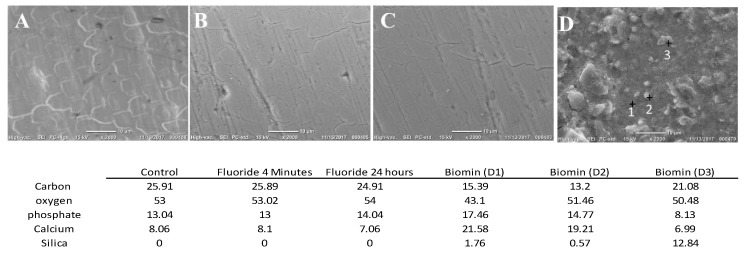
Figure 5.
Top surface examination by SEM/EDS for the four groups. (Control) group (A), the (fluoride 4 min) (B), and the (Fluoride-24 h) (C) show the boundaries of the enamel prisms. Biomin group (D) shows the formation of a newly formed layer having crystal like structures and silica particles. The table shows the mass percentages of each element detected by EDS in each group.

