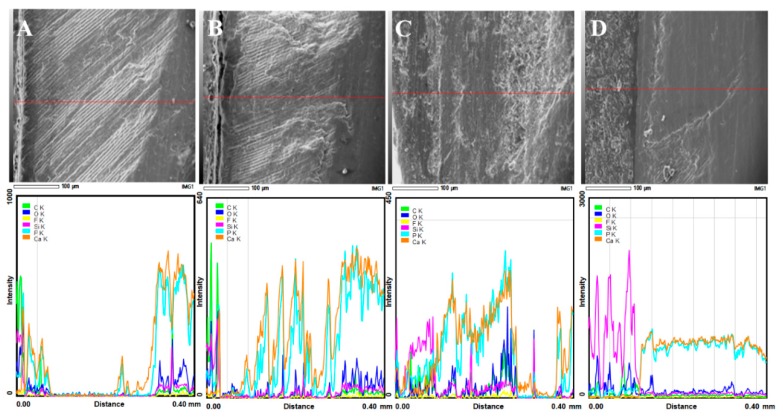
Figure 6.
The (Control) group (A), the (fluoride 4 min) (B), and the (Fluoride-24 h) (C) specimens showed demineralization of the subsurface area, with deterioration of the micro-morphological features of the demineralized areas. Biomin group (D) showed remineralization of the subsurface areas, with strong calcium and phosphate peaks in the surface re-mineralized areas.

