Figure 2.
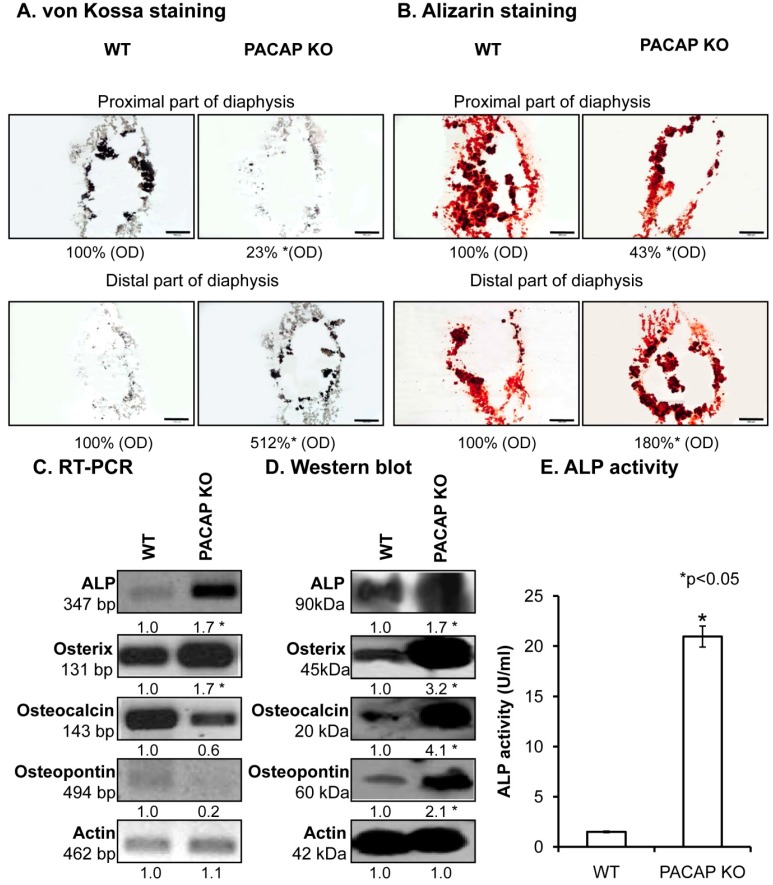
Investigation of inorganic matrix production of long bones. von Kossa (A) and alizarin red (B) staining of cryosectioned samples. Original magnification was 4×. Scale bar: 500 µm. Optical density (OD) was determined in microphotographs and normalised to wild type samples. mRNA (C) and protein (D) expression of alkaline phosphatase (ALP), osterix, osteocalcin and osteopontin of femurs. For reverse transcription followed by polymerase chain reaction (RT-PCR) and Western blot reactions, actin was used as control. Optical signal density was measured and results were normalised to the controls. For panels (C,D) numbers below signals represent integrated signal densities determined by ImageJ software. (E) ALP activity in compact bone. Asterisks indicate significant (* p < 0.05) alteration of ALP activity compared to the respective control. Representative data of 3 independent experiments.

