Figure 2.
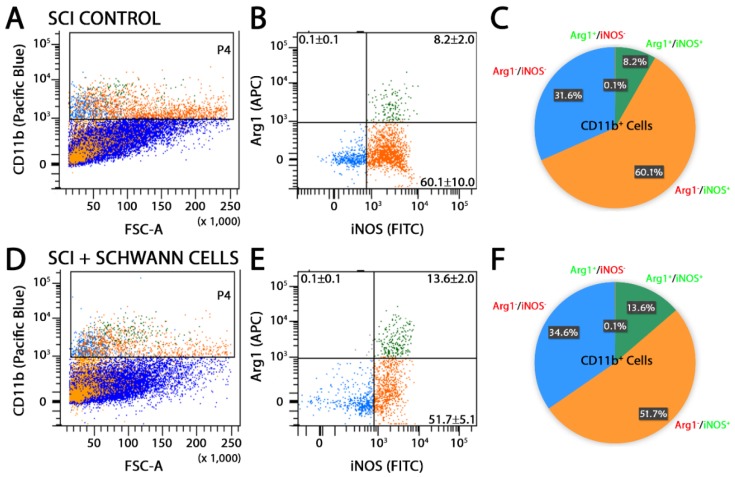
SC transplantation shifted the CD11b immune cell population from an Arg1−iNOS+ pro-inflammatory to an intermediate Arg1+iNOS+ phenotype after SCI. Representative images of flow cytometry analysis and pie charts of CD11b population dynamics at 14 days post-injury (7 days post-transplantation) show, compared with SCI controls (A–C), a decreased percentage of CD11b cells stained with Arg1−iNOS+ and an increased percentage for Arg1+iNOS+ in animals receiving SC transplants (D–F). Results are expressed as mean ± standard deviation (SD). Abbreviations on the graphs are: Fluorescein isothiocyanate (FITC), Allophycocyanin (APC) and Forward Scatter (FSC-A). For panels (B,E), the blue dots represent the CD11b population that is iNOS−-Arg1−, the orange dots represent the CD11b population that is iNOS+-Arg1− and the green dots represent the CD11b population that is double positive for both iNOS+-Arg1+. These colored dots are also shown in the forward scatter plots of panels (A,D).

