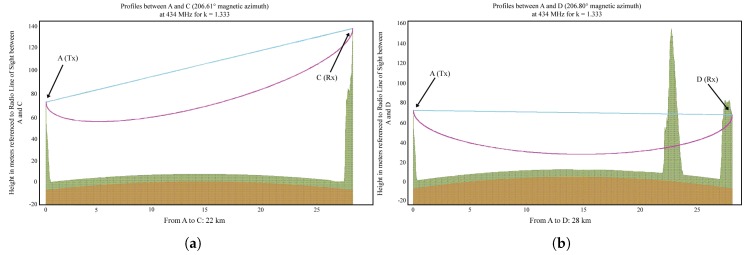
Figure 5.
Terrain profiles for: (a) Line-of-Sight path over sea. (b) Obstructed path over sea. Brown area indicates the curvature of the earth, modified by the refraction index; Green area is the terrain profile as seen by the radio wave and magenta line corresponds to 60% of the first Fresnel zone at MHz; and blue line is the optical line of sight.

