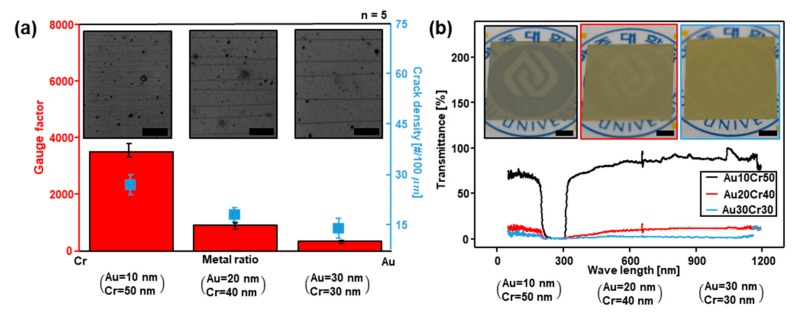
Figure 3.
Sensitivity, density and transmittance change of crack sensor according to the ratio of the metal layer. (a) Microscopic images and a plot, gauge factor (red column), crack density (blue square) changes according to the metal ratio. Scale bar = 50 . (b) Transmittance change of crack sensor according to the wave length. Scale bar = 1 cm. (left: Cr50, Au10 Middle: Cr40, Au20, Right: Cr30 Au30).

