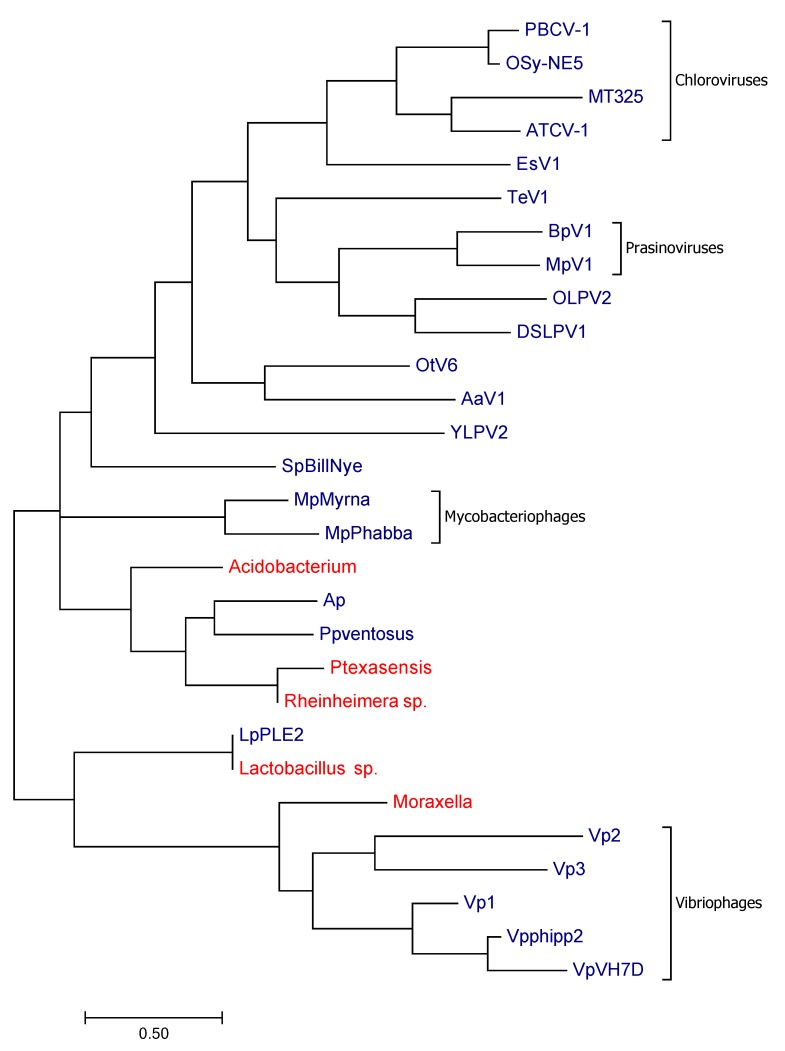
Figure 2.
Maximum likelihood tree of K+ channel proteins. The tree includes sequences from viruses (blue) and sequences from cellular organisms (red) that were most similar to the viral sequences. A possible evolutionary history of the diverse channels is inferred from the maximum likelihood method based on the JTT matrix-based model [38]. Here we show the tree with the highest log likelihood (−3715.28). The tree was obtained as described in [38] from a combination of neighbor-joining and BioNJ algorithms. The tree is presented in such a way that the branch lengths are a measure for the number of substitutions per site. The analysis is based on 29 protein sequences. All positions containing gaps and missing data were eliminated. In the present case we considered a total of 69 positions in the final dataset. For the evolutionary analyses we used MEGA7 software. The alignment for the sequences used in this tree is shown in Figure S1B.

