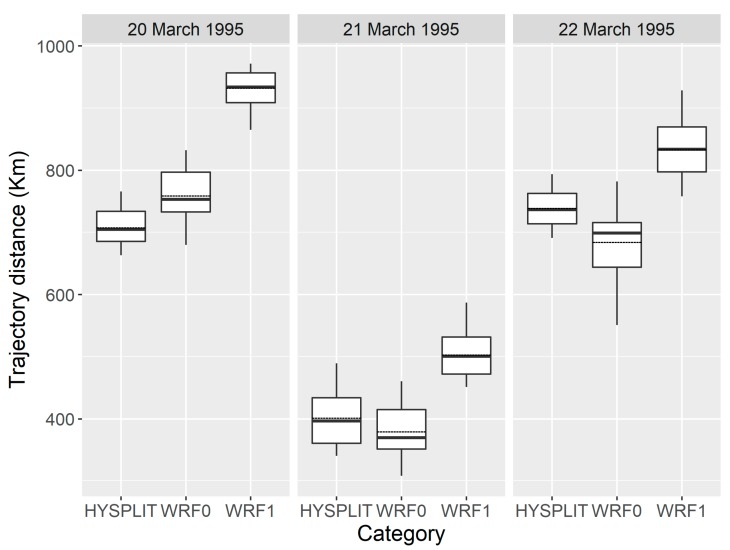
Figure 6.
The distance from the starting source area to the endpoints of H. zea migration trajectories calculated by the HYSPLIT, WRF0 and WRF1, respectively. The bottom and top of the box indicate the lower and upper quartile values, respectively. The horizonal solid black line shows the median for each category, and the black dashed line represents the mean. Whiskers indicate the 5th and 95th percentiles.

