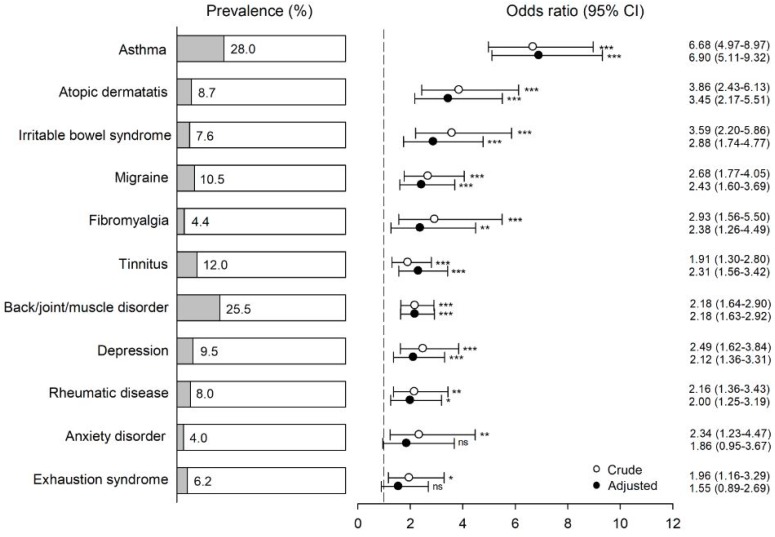
Figure 2.
Percentage of physician-based diagnoses among participants with self-reported building-related intolerance (single-item question on getting symptoms, when most other people do not, from residing in a certain building; n = 275). Odds ratios (ORs), confidence intervals (CIs), and p-values (* p < 0.05, ** p < 0.01, *** p < 0.001, and ns nonsignificant) for comorbidity with these conditions are given as both unadjusted and adjusted for sex and marriage/cohabiting. Referents were used as a reference group (n = 4180). The vertical dashed line represents an OR of unity.

