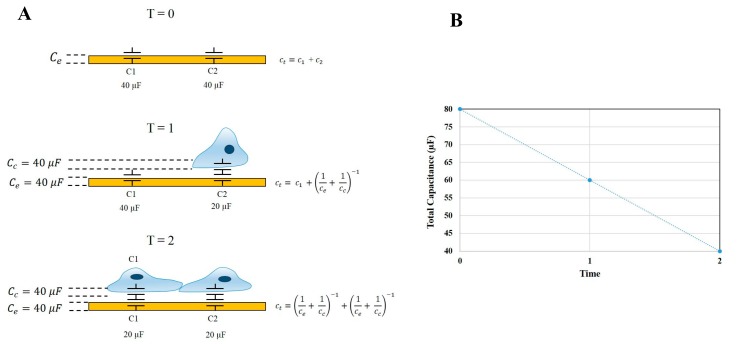
Figure 2.
Diagrammatic description of ECIS-Zθ capacitance theory. (A) The attachment and cell growth over an ECIS electrode over time. At T = 0 the total capacitance (CT) of the system is equal to the sum of the electrode capacitance (Ce) in parallel. As cells progressively adhere to the surface electrodes, an increasing proportion of CT is represented by the cell-electrode capacitance (Cc). The cell-electrode capacitance can be interpreted as capacitors connected in series; (B) Graphical representation of the change in total capacitance over time, as cells adhere to and cover exposed electrode areas.

