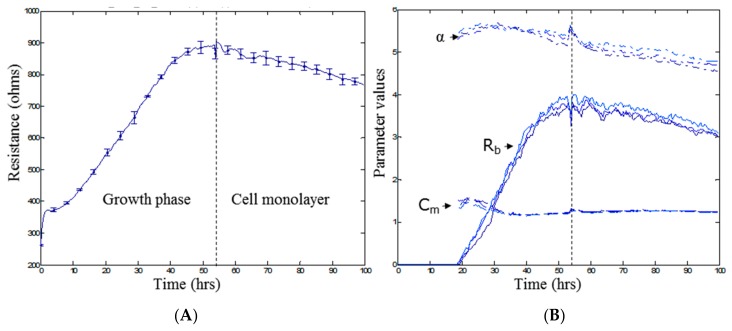
Figure 3.
Monitoring parameters R (Ω), Rb (Ω cm2), α (Ω0.5 cm), and Cm (µF/cm2). (A) Time course of resistance magnitude at 4000 Hz for endothelial cells. Influence of the cell growth phase and formation of a cell monolayer on resistance; (B) Time course of modelled parameter magnitudes. Illustration of the changes in the three parameters Rb, α, and Cm as a result of cell growth and monolayer formation as can be seen by an increase in Rb overtime. Time point 0 h denotes the time at which cells were seeded at 20,000 cells per well. Data (A) show the mean ± SD (n = 3 wells) of one independent experiment representative of three experimental repeats.

