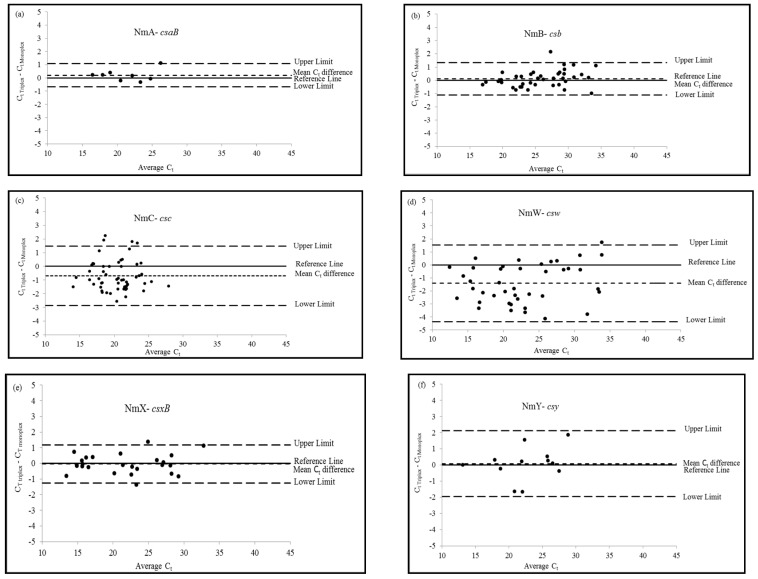
Figure 1.
Bland-Altman Plots resulting from the pairwise comparison of Ct values between triplex and monoplex direct real-time PCR assays by meningococcal serogroups: (a) NmA-csaB; (b) NmB-csb; (c) NmC-csc; (d) NmW-csw; (e) NmX-csxB; and (f) Nm-csy. Level of agreement between the two assays by serogroup (Ct Triplex − Ct Monoplex), also known as observed mean difference (small dash line), is presented as a function of the average Ct values of the two assays [(Ct Triplex + Ct Monoplex)/2]. Reference lines (solid line) indicate the ideal zero difference. Upper and lower limits of agreement (large dash lines) defined by mean Ct difference +/− 1.96 × SD.

