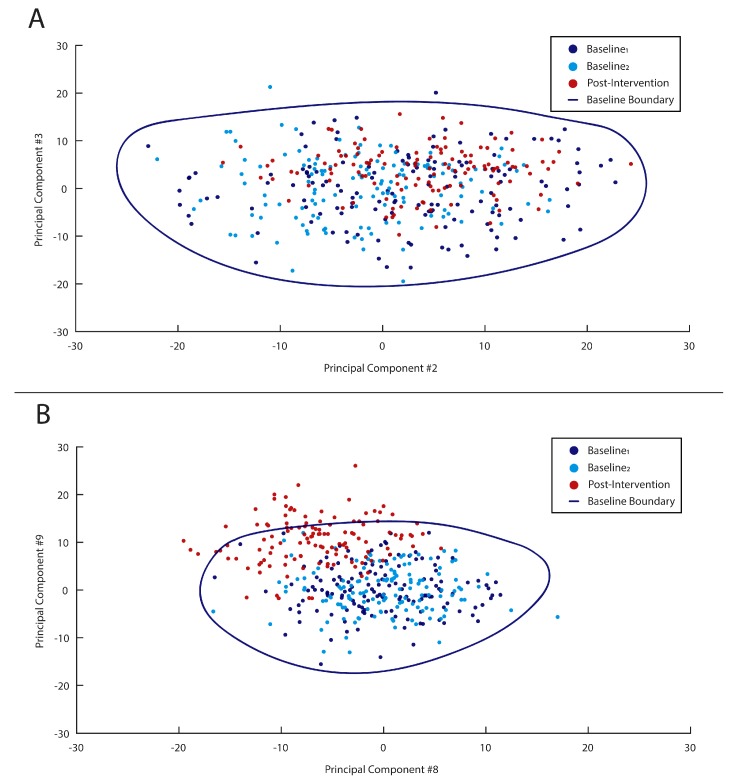
Figure 2.
Simplified visualizations of boundary definitions (blue line) defined by baseline data (dark blue and light blue circles) and tested on post-intervention data (red circles). In example (A), no post-intervention gait cycles are defined as outliers, while in example (B) approximately 30% are viewed as outliers.

