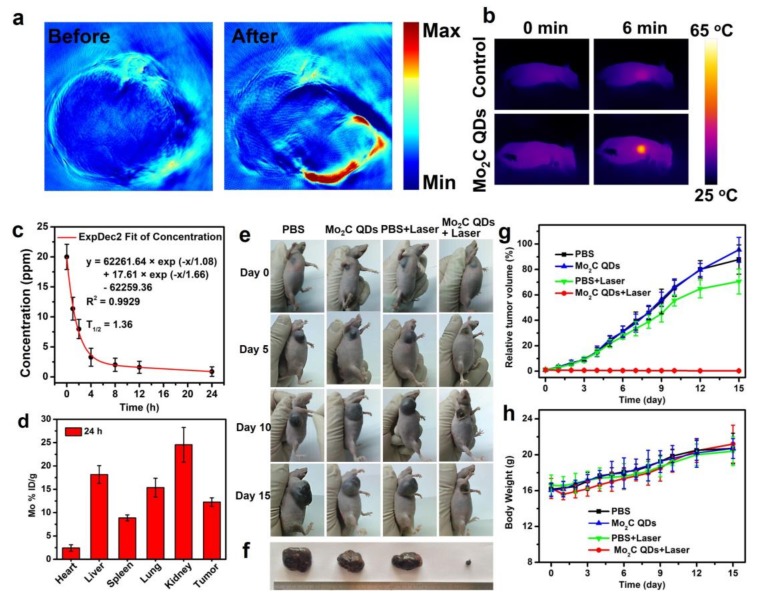
Figure 5.
(a) In vivo PA images of a tumor-bearing mouse taken at before and after intravenous injection of Mo2C QDs; (b) IR thermal images at tumor site of a tumor-bearing mouse under an 808 nm laser irradiation (0.64 W/cm2) (c) The blood circulation lifetime of Mo2C QDs after intravenous injection into nude mice (n = 5); (d) The biodistribution of Mo in main tissues and tumor after intravenous injection for 24 h; (e) Photographs of tumor-bearing mice at different time points; (f) Photographs of tumors after the treatments; (g) The tumors growth curves and (h) body weight curves of tumor-bearing mice in different groups.

