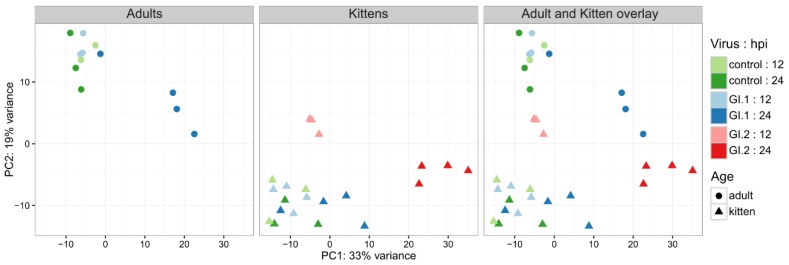
Figure 1.
Similarity of gene expression profiles across rabbit age cohorts during infection with different GI viruses. GI.1-infected kittens had the smallest transcriptomic response after infection, while large changes were observed from 12 hpi in GI.2-infected kittens, and in GI.1-infected adults at 24 hpi. Notably, expression profiles varied considerably between adult and kitten control rabbits. Expression values from the top 500 most variable genes across the samples were normalized using regularized log transformation and plotted using principal component analysis.

