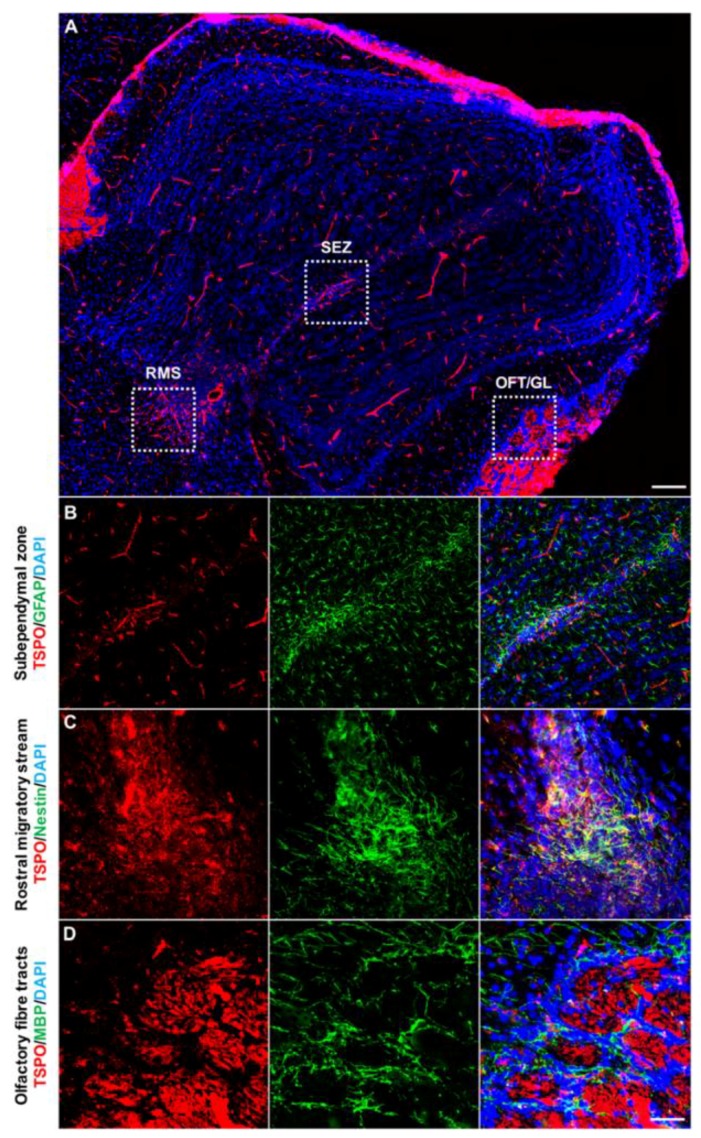
Figure 3.
TSPO expression across the olfactory bulb in the normal mouse brain. (A) Sagittal view of TSPO expression (red) across the olfactory bulb. Structural features of the region highlighted with DAPI (blue). (B) Concentrated TSPO expression (red) is observed in the subependymal zone, which houses a neural stem cell niche derived from the rostral migratory stream (RMS). TSPO colocalizes at low levels with GFAP+ (green) cells. (C) TSPO is present at the base of the RMS, entering into the olfactory bulb. Here, TSPO strongly colocalizes with Nestin+ (green) cells. (D) TSPO expression (red) is also observed in the olfactory nerve layer and glomerular layer, though does not colocalize with MBP+ oligodendrocytes (green) of the region. Scale bars = 300 µm for (A), 20 µm for (B–D). RMS = rostral migratory stream, SEZ = subependymal zone, OFT = olfactory fibre tracts, GL = glomerular layer.

