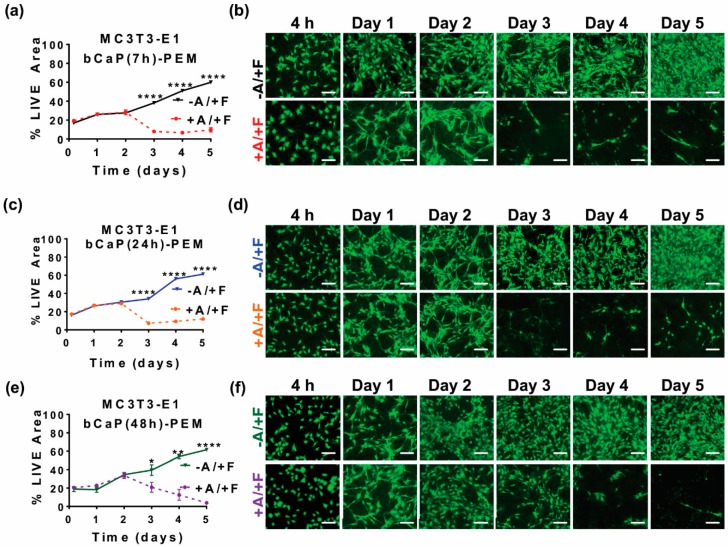
Figure 3.
MC3T3-E1 osteoprogenitor cells cultured on bCaP of varying thickness with PEM present: (a) percent LIVE® stained area of MC3T3-E1s cultured on bCaP(7 h)-PEM30-FGF2 without Antimycin A (−A/+F) and AntiA-bCaP(7 h)-PEM30-FGF2 with Antimycin-A (+A/+F) (**** p < 0.0001); (b) fluorescent LIVE® stained images of MC3T3-E1 cells on bCaP(7 h)-PEM30-FGF2 (−A/+F) and AntiA-bCaP(7 h)-PEM30-FGF2 (+A/+F); (c) percent LIVE® stained area of MC3T3-E1s cultured on bCaP(24 h)-PEM30-FGF2 (−A/+F) and AntiA-bCaP(24 h)-PEM30-FGF2 (+A/+F) (**** p < 0.0001); (d) fluorescent LIVE® stained images of MC3T3-E1 osteoprogenitor cells on bCaP(24 h)-PEM30-FGF2 (−A/+F) and AntiA-bCaP(24 h)-PEM30-FGF2 (+A/+F); (e) percent LIVE® stained area of MC3T3-E1 osteoprogenitor cells cultured on bCaP(48 h)-PEM30-FGF2 (−A/+F) and AntiA-bCaP(48 h)-PEM30-FGF2 (+A/+F) (* p < 0.05, ** p < 0.01, **** p < 0.0001); and (f) fluorescent LIVE® stained images of MC3T3-E1 cells on bCaP(48 h)-PEM30-FGF2 (−A/+F) and AntiA-bCaP(48 h)-PEM30-FGF2 (+A/+F). Time points 4 h, one–five days. Scale bar = 100 μm.

