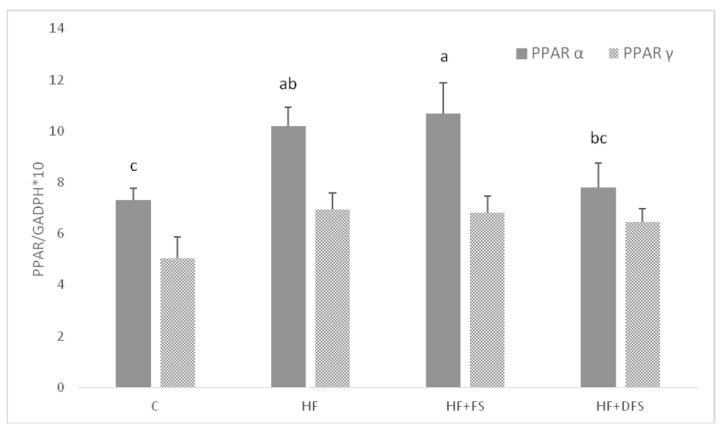
Figure 1.
qRT-PCR analysis of PPARα and PPARγ mRNA expression in rat livers. All values are expressed as the mean ± SEM (n = 8). Values not sharing the same superscript (a,b,c) within a row are different at p ≤ 0.05. C: group fed a standard diet for laboratory rodents; HF: group fed a high saturated fat-containing diet; HF + FS: group fed a high saturated fat-containing diet supplemented with native flaxseeds; HF + DFS: group fed a high saturated fat-containing diet supplemented with defatted flaxseeds; PPARα: peroxisome proliferation-activated receptor α; PPARγ: peroxisome proliferation-activated receptor γ; GAPDH: glyceraldehyde 3-phosphate dehydrogenase (housekeeping gene); qRT-PCR: quantitative reverse transcriptase real-time polymerase chain reaction.

