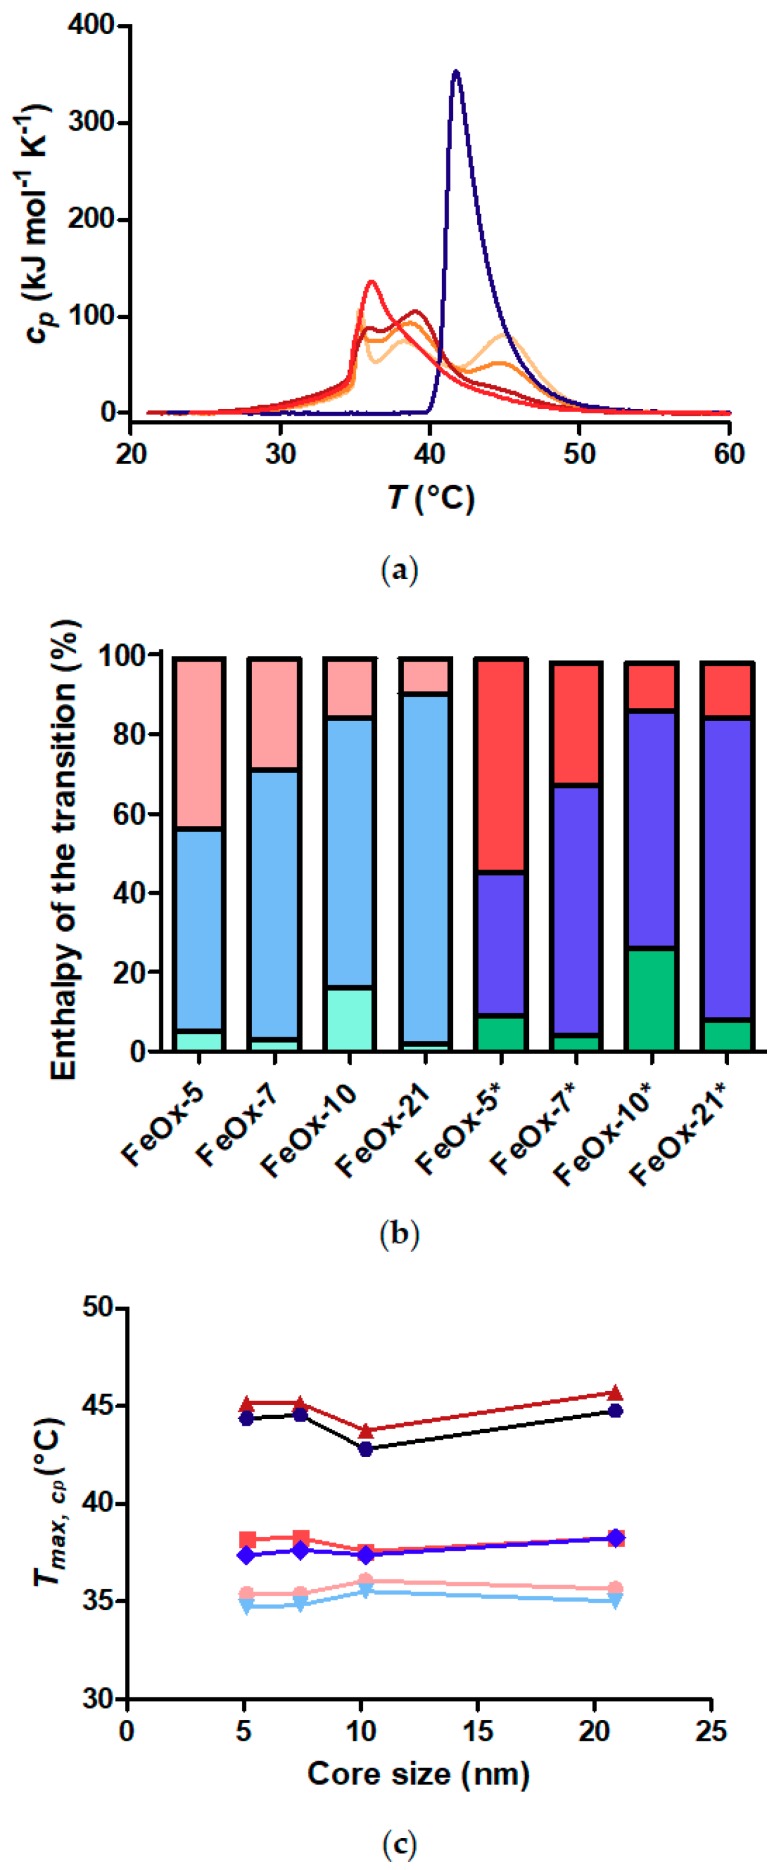
Figure 6.
DSC transition peak analysis. (a) Overlay of DSC endotherms of free polymer (dark blue), FeOx-5 (light orange), FeOx-7 (orange), FeOx-10 (red) and FeOx-21 (dark red) at a polymer concentration of 1 g L−1; (b) Fraction of the total transition enthalpy of each fitted transition peak for core-shell nanoparticles. All DSC curves were fitted with three Gaussian curves. The enthalpy of each fitted Gaussian was normalized by the total enthalpy of the transition to obtain the plotted fractions. Each bar presents the contribution to the total peak area at a polymer concentration of 1 g L−1. Contributions of the lowest (green), intermediate (blue) and highest (red) temperature transitions were assigned to the inner, intermediate and outer shell, respectively. Heating curves are left and cooling curves are right, with the latter marked by *; (c) Temperature of maximum () of each deconvoluted transition peak at a polymer concentration of 1 g L−1.

