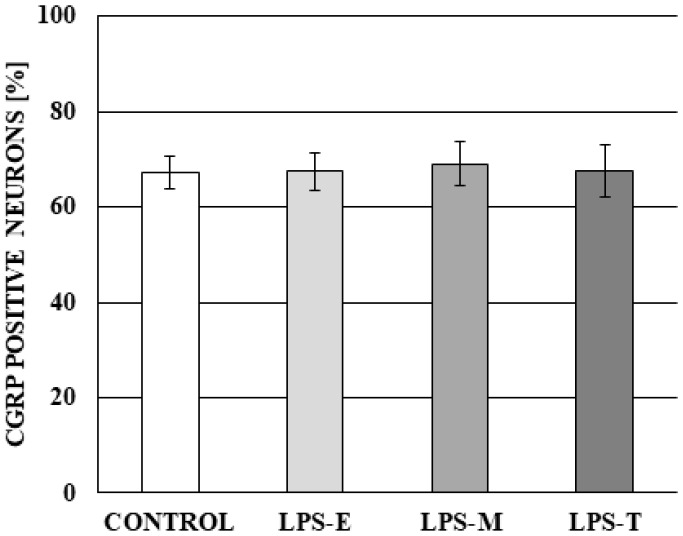
Figure 5.
The percentage of neurons in dorsal root ganglia immunoreactive to calcitonin gene-related peptide (CGRP) in control group and under the impact of LPS from S. Enteritidis (LPS-E), S. Minnesota (LPS-M), and S. Typhimurium (LPS-T). Statistically significant differences for p < 0.001 as compared to the control group.

