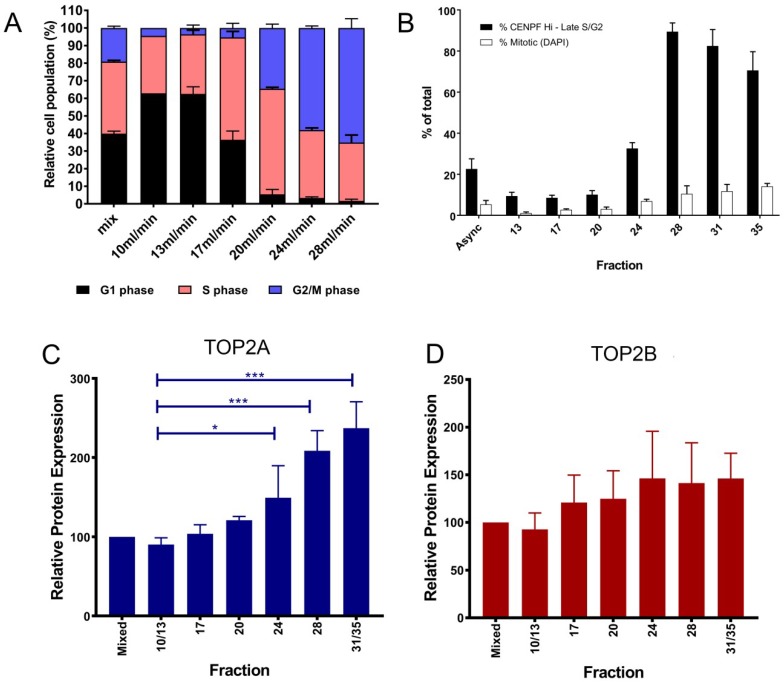
Figure 2.
Elutriation of K562 cells separates the cells according to size. (A) FACS analysis (Flowjo) of each elutriation fraction showing the percentage of G1, S or G2/M phase cells. (B) Immunofluorescence analysis of each elutriation fraction showing the percentage of each fraction in lateS/G2/M determined by CENPF immunofluorescence and the percentage of mitotic cells determined by DAPI staining. (C,D) TOP2A and TOP2B protein level per cell was determined by quantitative immunofluorescence [77], the data shown represent the mean ± SEM of median values obtained from three replicate experiments. Statistical analysis was carried out using one way ANOVA (* p < 0.05; *** p < 0.0001).

