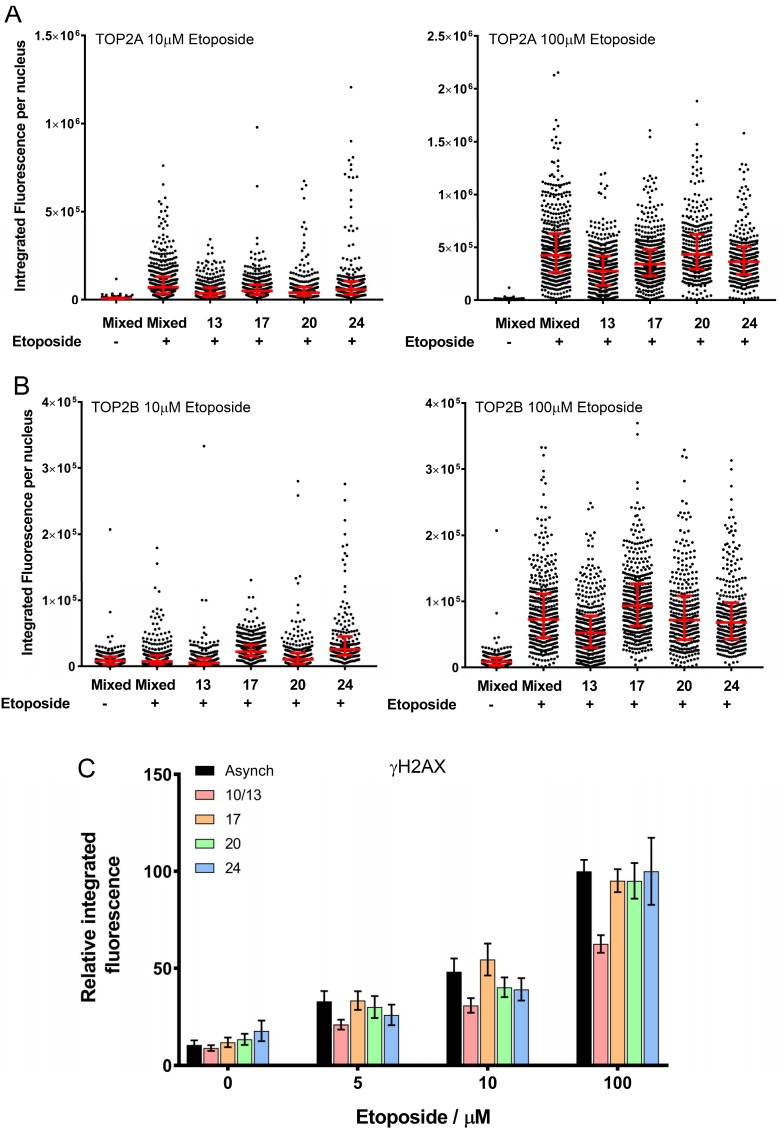
Figure 3.
TOP2 covalent complex levels determined by trapped in agarose DNA immunostaining (TARDIS) and γH2AX integrated fluorescence. Quantification of etoposide-induced TOP2A and TOP2B covalent-DNA complexes, (A,B, respectively). Cells from each elutriated fraction were treated with etoposide (10 or 100 μM) and TOP2-DNA covalent complexes were detected and quantified by TARDIS analysis [73,74,75,77]. The data are shown as scattergrams, derived from a single representative experiment. Bars represent the median and interquartile range. (C) Cells from each elutriated fraction were treated with etoposide (5, 10 or 100 μM) or solvent (DMSO) and analysed by γH2AX immunofluorescence; the level of γH2AX integrated fluorescence was determined by quantitative immunofluorescence [77]. The data are shown as means of the medians obtained from three replicate experiments.

