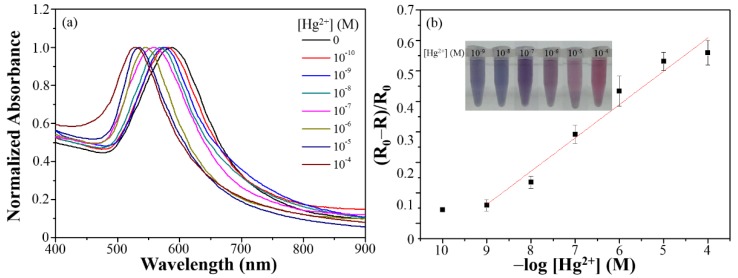
Figure 9.
(a) UV–Vis absorbance spectra and (b) linear responses of the catalytic effect plotted against the Hg(II) concentration. Inset: photographs of the H-AuNS probe in the presence of HCl/Au(III)/H2O2 solution at different Hg(II) concentrations. Error bars represent standard deviations from three repeated experiments.

