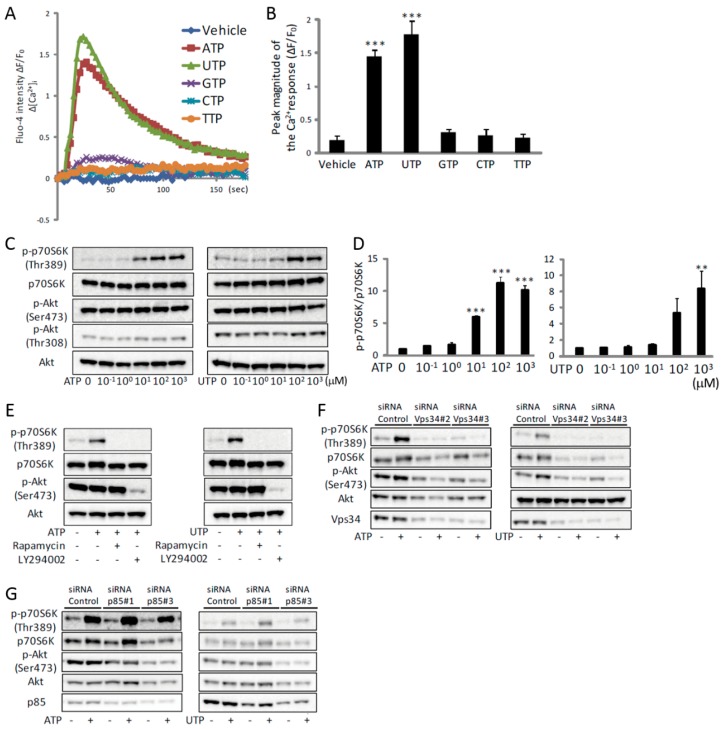
Figure 2.
ATP induces an increase in [Ca2+]i and activation of mTOR via Vps34 in C2C12 myotubes. (A) Traces of Fluo-4 fluorescence in C2C12 myotubes treated with nucleotide triphosphates at a concentration of 100 µM (n = 4). (B) Quantitative analysis of peak magnitudes of (A) (n = 4). (C) Representative Western blot analysis showing concentration-dependent effects of ATP (left) or UTP (right) on phosphorylation of p70S6K and Akt (n = 4). (D) Quantitative signal intensities of p-p70S6K/p70S6K in (C) (n = 4). (E–G) Representative Western blot analysis showing the effects of rapamycin or LY294002 (E), siRNA for Vps34 (F) or p85 (G) on ATP- or UTP-induced phosphorylation of p70S6K and Akt (n = 4). The concentration of ATP and UTP in (E–G) was 100 µM and the duration of treatment in all experiments shown in this figure was 30 min. ** p < 0.01, *** p < 0.001 by ANOVA with Tukey-Kramer test. Error bars indicate S.E.M.

