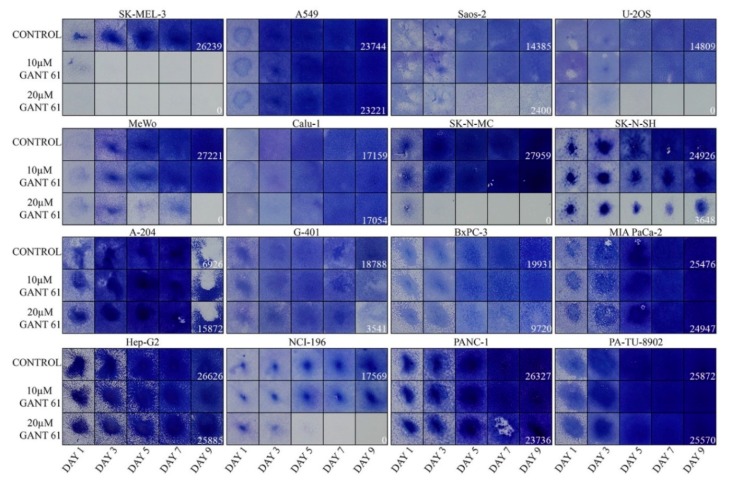
Figure 2.
Proliferation assays showing the sensitivity to GANT61. The intensity of staining with crystal violet indicates the relative number of cells. The quantification numbers are given only for day 9 for controls and GANT61 (20 μM) as these fields were the most important outcome of the experiment. Please note that the lower number of A-204 control cells at day 9 is caused by cell detachment. Two experiments with similar results were performed and one is presented. Results are shown as squares cut from the 12-well plate wells.

