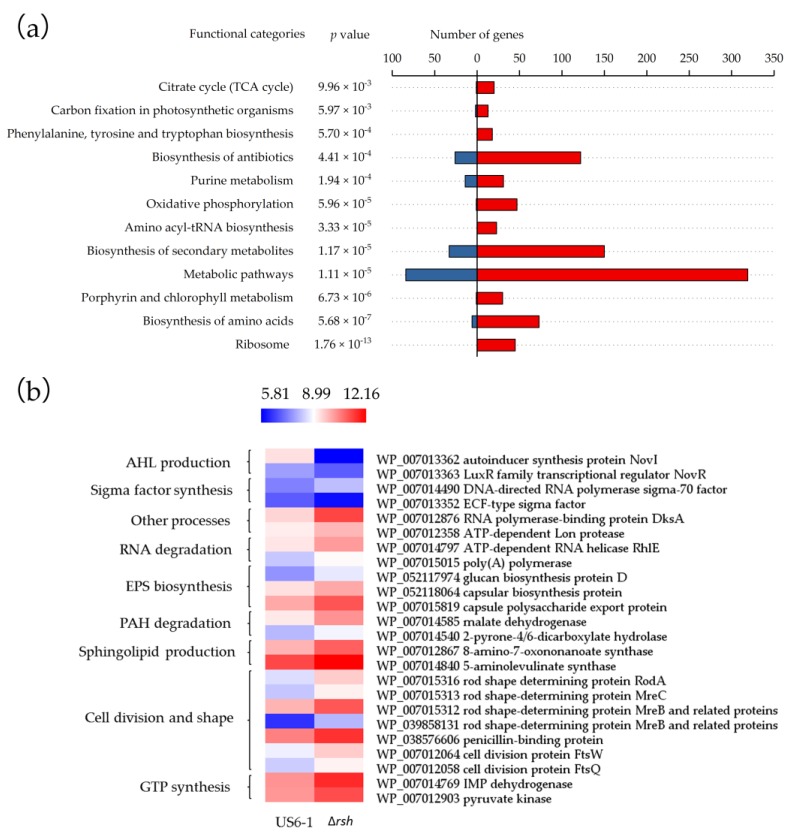
Figure 4.
Differentially expressed genes (DEGs) overview (∆rsh vs. US6-1) in the RNA-seq data. (a) Over-represented Kyoto Encyclopedia of Genes and Genomes (KEGG) categories. KEGG annotation and pathway enrichment analysis was performed using the KEGG pathway database (http://www.genome.jp/kegg/). The p values denote the enriched levels in a KEGG pathway, which was calculated using a Fisher’s exact test [42]. Up- and down-regulated genes (∆rsh vs. US6-1) are represented by red and blue bars respectively, representing the number of genes per functional category. (b) Heat map of log2 expression ratios of specific DEGs involved in AHL production, sigma factor synthesis, RNA degradation, EPS biosynthesis, PAH degradation, sphingolipid production, cell division and shape, GTP synthesis and other functions in strain US6-1 and ∆rsh. Expression values are reflected by red-blue coloring as indicated. The heat map was drawn by the software HemI [43].

