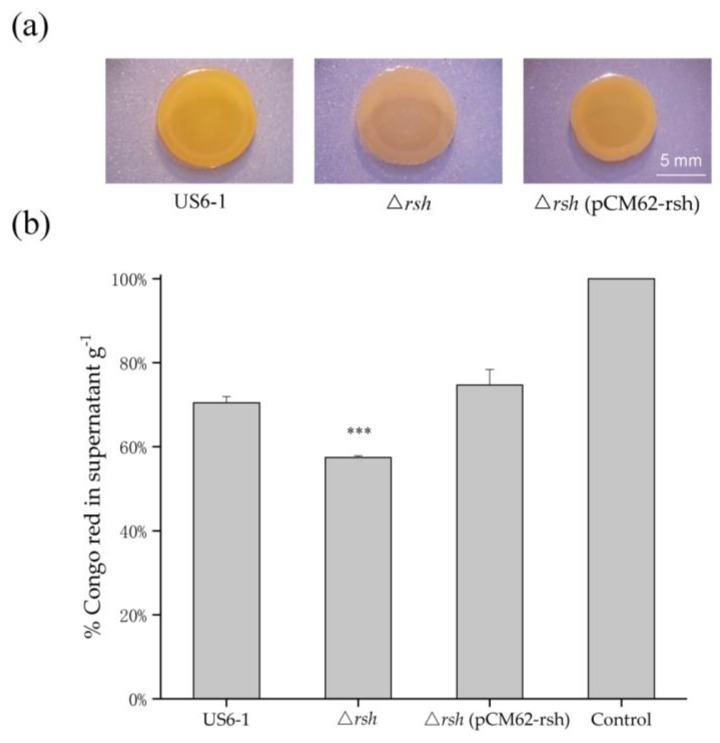
Figure 6.
Assessment of EPS production of strain US6-1, ∆rsh and ∆rsh (pCM62-rsh). (a) Colony biofilm morphology of strains on the P5Y3 plates containing 40 μg/mL Congo red. One representative experiment out of three independent biological replicates is shown. The white bar represents 5 mm. (b) Congo red binding assay. The biomass of strains grown in static culture for 96 h was determined gravimetrically as cell wet weigh. The bacterial mass was then mixed with 1 mL of Congo red (100 μg/mL) in 0.9% saline for binding. After removing the biomass, the OD490 of unbound Congo red in supernatant was measured and the percentage of Congo red left in supernatant g−1 was shown. The OD490 of 100 μg/mL Congo red in 0.9% saline was used as the control. The results are averages of three replicates, and the error bars indicate standard deviations. “***” represents p < 0.001.

