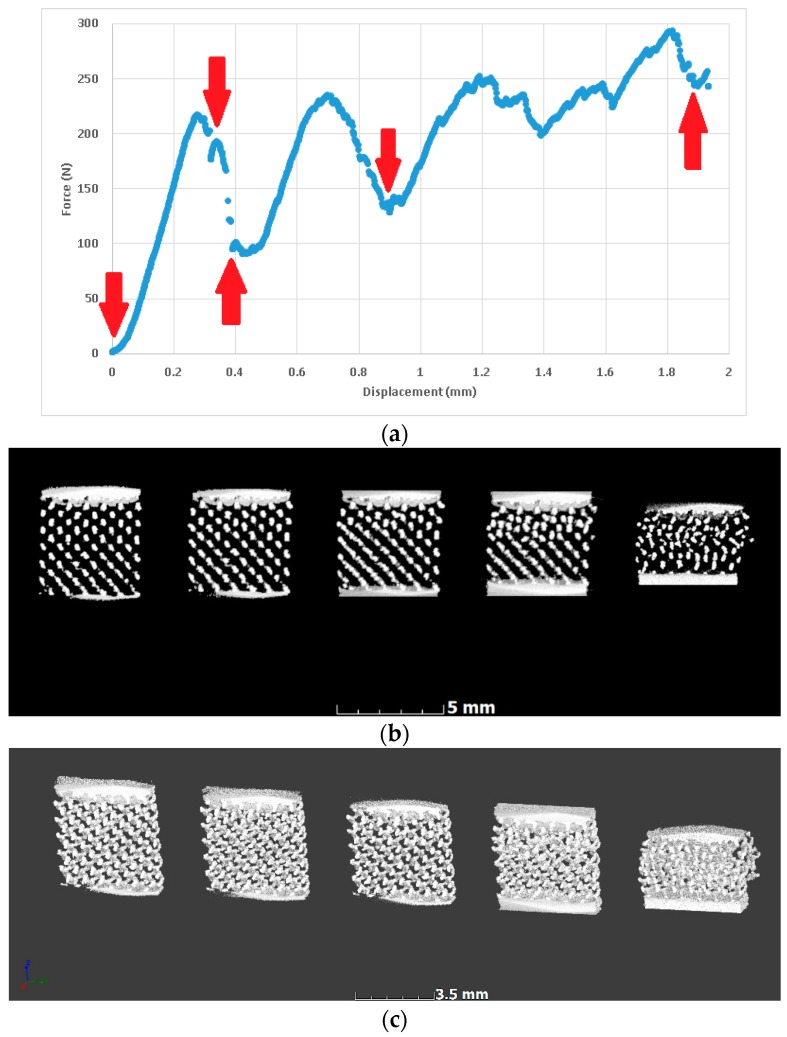
Figure 6.
In situ deformation imaging of a lattice (0.8 mm unit cell) at the selected points during yielding; steps are shown as arrows in the force-displacement curve. (a) Force-displacement with red arrows indicating steps for microCT scans (stop); (b) MicroCT slice images at each step showing collapse; (c) The corresponding microCT 3-D images of the lattice at each step (cropped).

