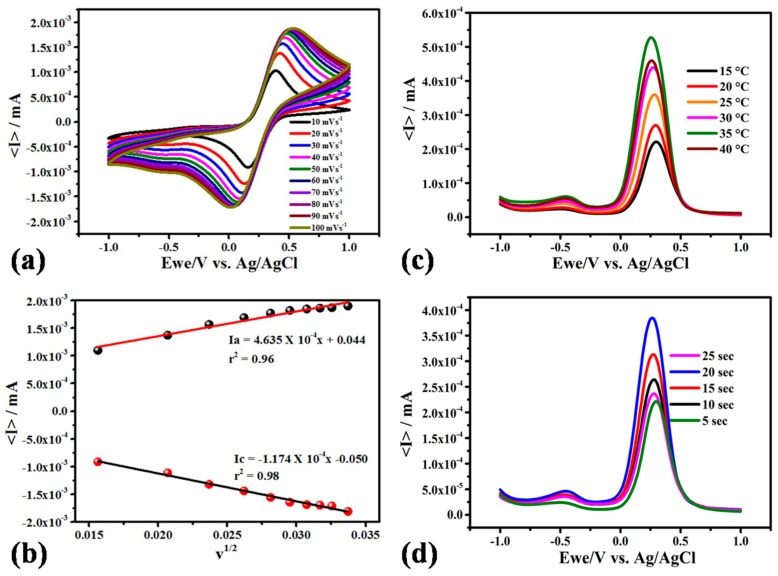
Figure 4.
(a) Cyclic Voltammogram of probe modified electrode at different scan rates ranging from 10 to 100 mV/s. (b) Corresponding peak current vs square root potential ranging from 10 to 100 mVs−1. (c) Differential pulse voltammogram of probe modified electrode at different temperature ranging from 15 °C–40 °C. (d) Differential pulse voltammogram obtained at different response time ranging from 5–25 s. All optimization studies were done using 1 µM MB (pH 7.4) in 0.1 M KCl.

