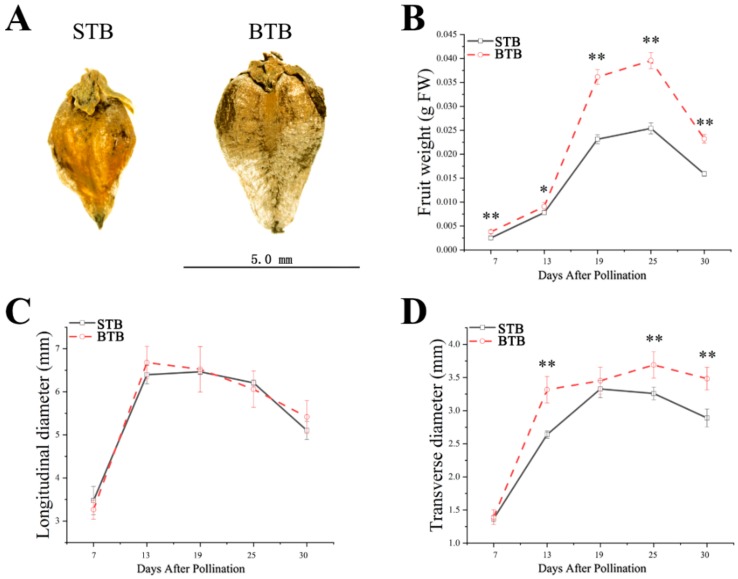
Figure 1.
Fruit growth patterns of different accessions of Tartary buckwheat. (A) Pictures of mature fruits of the two accessions. (B) Average fresh weight of one fruit of the two Tartary buckwheat accessions (STB, black squares; BTB, red circles) is plotted against the developmental stages (days after pollination) (n = 5). (C) Average longitudinal diameter of one fruit of the two Tartary buckwheat accessions (STB, black squares; BTB, red circles) is plotted against the developmental stages (days after pollination) (n = 5). (D) Average transverse diameter of one fruit of the two Tartary buckwheat accessions (STB, black squares; BTB, red circles) is plotted against the developmental stages (days after pollination) (n = 5); * and ** indicate significant differences (α = 0.05; α = 0.01, least significant difference test (LSD)) among treatments, respectively.

