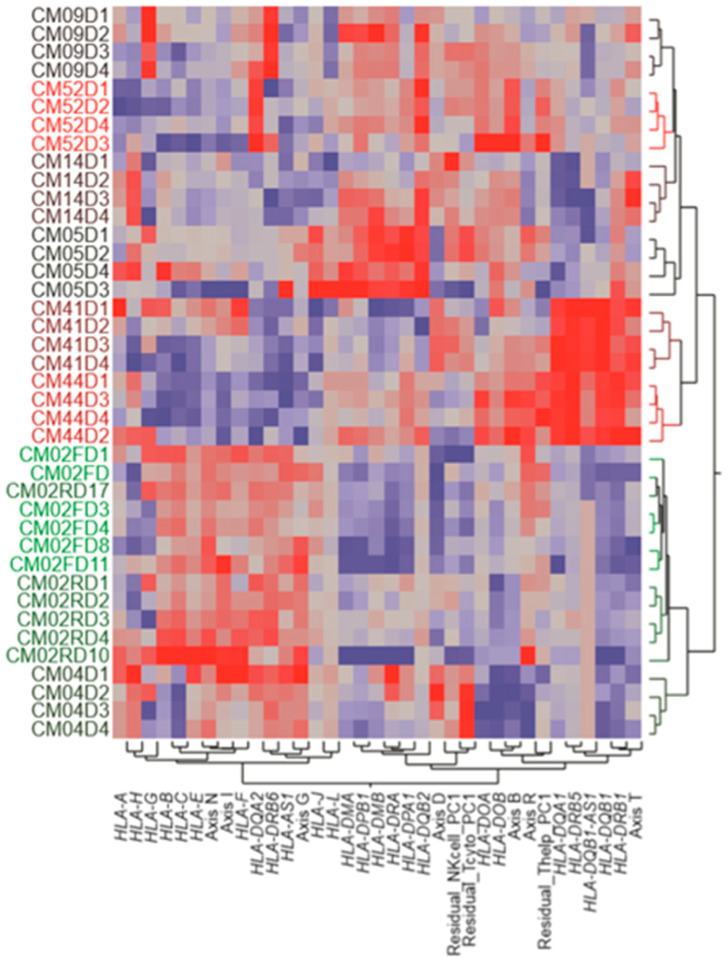
Figure 5.
Two-way hierarchical clustering of HLA complex gene expression by individual and time. Each row represents one patient on the day indicated by the last number of the label, and each column is the standardized expression of the indicated HLA gene or lymphocyte activity estimate. The figure highlights three clusters of co-expression, namely, HLA class I to the left and two HLA class II clusters in the middle and right of the grid.

