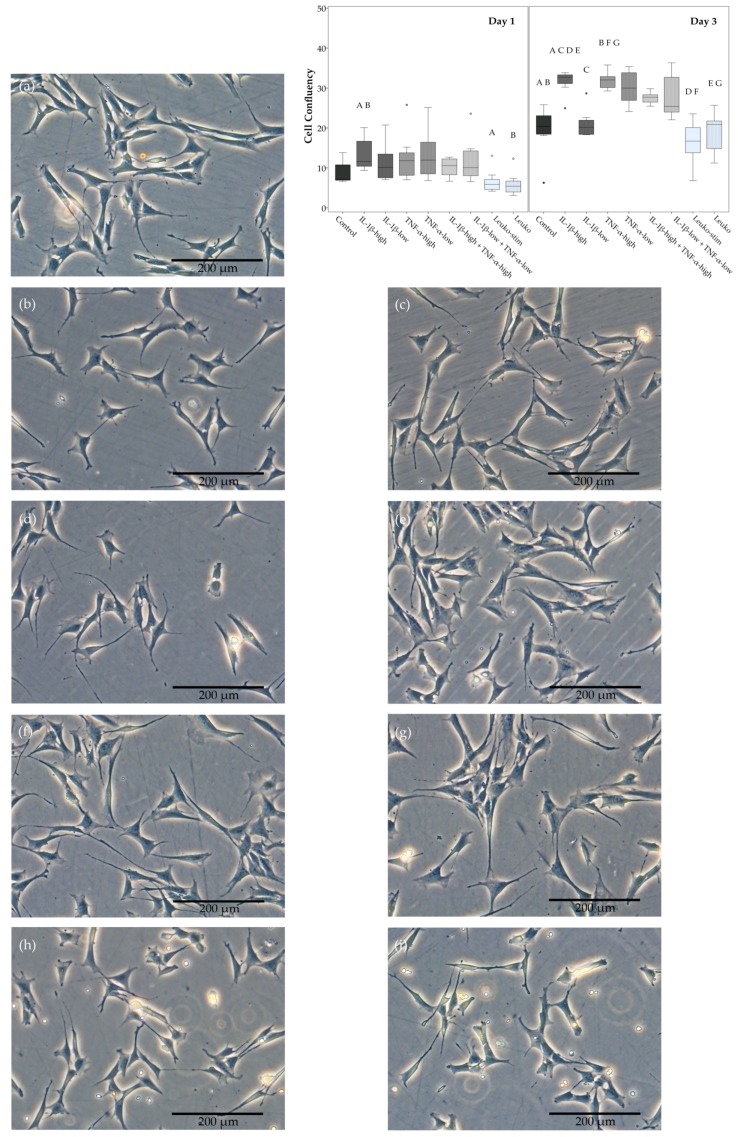
Figure 1.
Adipose-derived stromal cell (ASC) morphology and proliferation. Exemplary phase contrast images of ASC monolayer cultures in different inflammatory environments ((a) control; (b) IL-1β-high (10 ng/mL); (c) IL-1β-low (0.01 ng/mL); (d) TNF-α-high (50 ng/mL); (e) TNF-α-low (0.1 ng/mL); (f) IL-1β-high + TNF-α-high; (g) IL-1β-low + TNF-α-low; (h) co-culture with activated leukocytes (Leuko-stim); (i) co-culture with non-activated leukocytes (Leuko)) obtained at Day 1, and boxplot displaying confluency as a measurement of ASC proliferation. Data were obtained by quantitative analysis of phase contrast images from Day 1 and Day 3. Groups displayed by boxes sharing the same letter are significantly different from each other (p < 0.05; n = 7).

