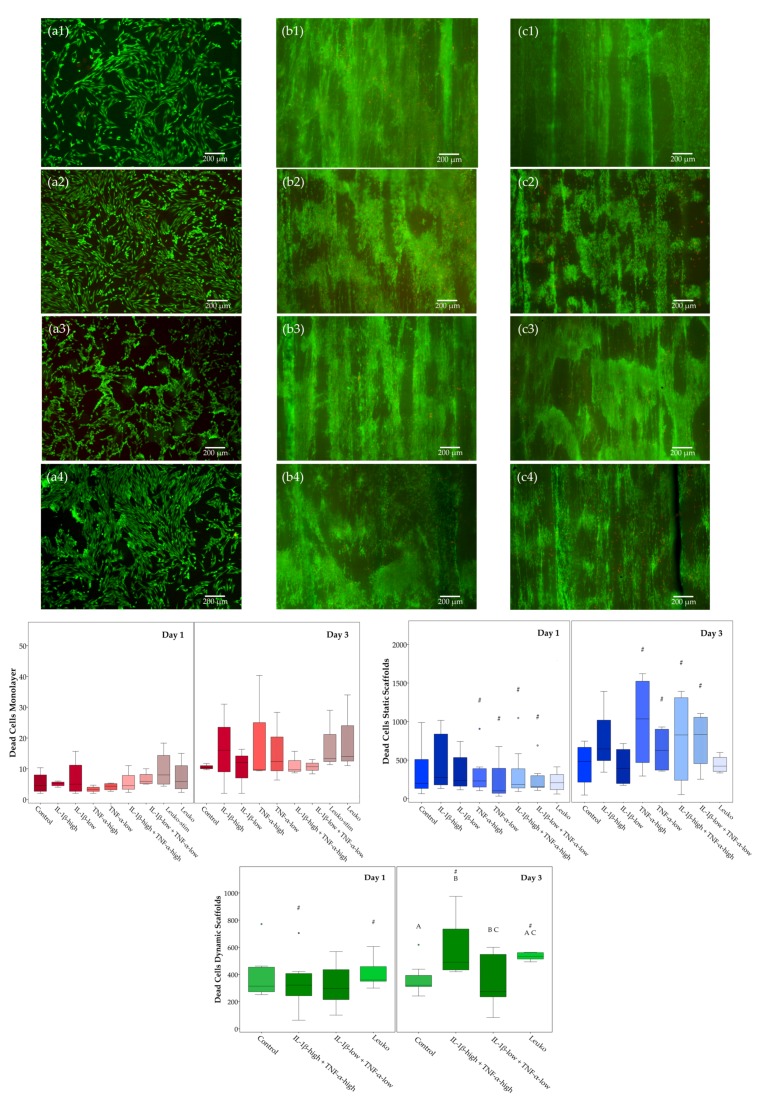
Figure 5.
LIFE/DEAD™ staining and analysis of dead cells. Exemplary images of adipose-derived stromal cells (ASC) in monolayer culture (first column, a1 to a4), static scaffold culture (second column, b1 to b4), and dynamic scaffold culture (third column, c1 to c4) in different inflammatory environments (first row, a1 to c1: control; second row, a2 to c2: IL-1β-high (10 ng/mL) + TNF-α-high (50 ng/mL); third row, a3 to c3: IL-1β-low (0.01 ng/mL) + TNF-α-low (0.1 ng/mL); fourth row, a4 to c4: co-culture with non-activated leukocytes (Leuko)) after LIVE/DEAD™ staining at day 3; viable cells are shown in green, dead cells in red; boxplots display the numbers of dead cells in the different culture conditions. Groups displayed by boxes sharing the same letter are significantly different from each other; hash marks (#) indicate significant differences between Day 1 and Day 3 (p < 0.05; n = 7).

